

The State of the North American Airline Industry
Heading into 2025, airlines were poised to build on the gains they achieved in 2024. Delta, for example, forecasted that 2025 might be its most profitable year on record. The International Air Transport Association (IATA) was predicting record profits for the global airline industry, with total net profits increasing $5.1 billion compared to 2024 (with the North American industry accounting for about 40 percent of that increase).
The positive outlook for 2025, however, didn’t apply to all airlines in North America. Network carriers were expected to continue to outperform discount carriers, and cargo carriers were expected to benefit from post-COVID e-commerce trends. In addition, some outside events (e.g., tariffs) and business model shake-ups have impacted the industry.
Looking at the second half of 2025, revenue and earnings remain under pressure as the industry contends with multiple demand crosscurrents. Key trends include a shorter booking curve, strong demand for premium products, continued weakness among price-sensitive travelers, lower-than-expected corporate demand, domestic softness compared with international outperformance, and de minimis cargo charges being reintroduced on e-commerce.
Listen to Podcast with ALPA President Capt. Jason Ambrosi
Global Economy Remains Resilient Despite Uncertainties Surrounding U.S. Policies
The pace of global economic growth is being shaped by trade developments. After raising tariffs to unprecedented levels, the United States has partly reversed course. However, the tariffs imposed by the United States remain at historically high levels, and global policy remains uncertain.
In the face of these widespread tariffs, the global economy continues to demonstrate notable resilience. Despite the initial shock, overall global economic activity has remained relatively robust, with most regions experiencing moderate growth (see Figure 1).
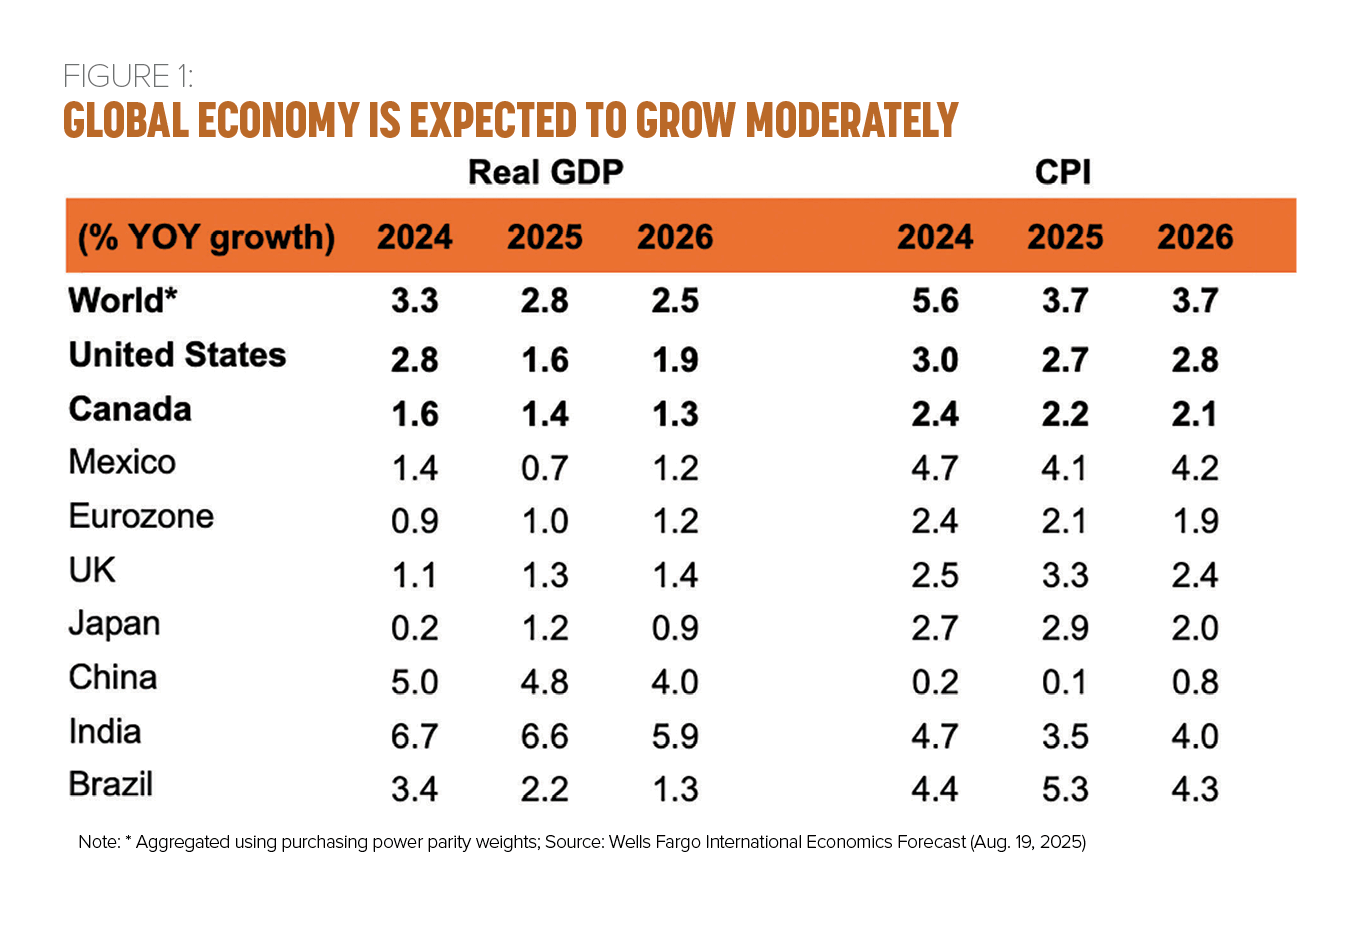
While global inflation continues to wane, the most recent data indicates that inflationary pressures are building. Focusing on the United States, import prices have remained largely unchanged or even increased this year, suggesting that the cost of tariffs is being borne by U.S. retailers—and eventually customers as businesses start to add these higher costs into their prices. As a result, the consensus among economists is that inflation will continue to be above the Federal Reserve’s target rate of 2 percent (see Figure 1).
U.S. Economic Outlook Is Uncertain
Trying to predict the economic future is always difficult, but now even more so due to unprecedented uncertainty created by the global trade war and economic policy more broadly. As Moodys’ Analytics Chief Economist Mark Zandi noted in early June, “In my 35 years as a professional economist, I’ve rarely been as unsure about the economic outlook as I am now.” And, following the release of the second-quarter gross domestic product (GDP), The Wall Street Journal editorial board stated that “[t]his may be the weirdest GDP report ever.”
In the first quarter, the U.S. economy shrank .5 percent, largely as a result of a surge in imports as businesses tried to front-load inventory in the face of the anticipated barrage of tariffs. Then, in the second quarter, the U.S. economy grew 3 percent, largely because imports collapsed. With net exports subtracting 4.6 points from first-quarter GDP growth and then adding 5 points to second-quarter GDP growth (both historic highs), a better way to assess the strength of the economy is to average the results of the first two quarters (see Figure 2).
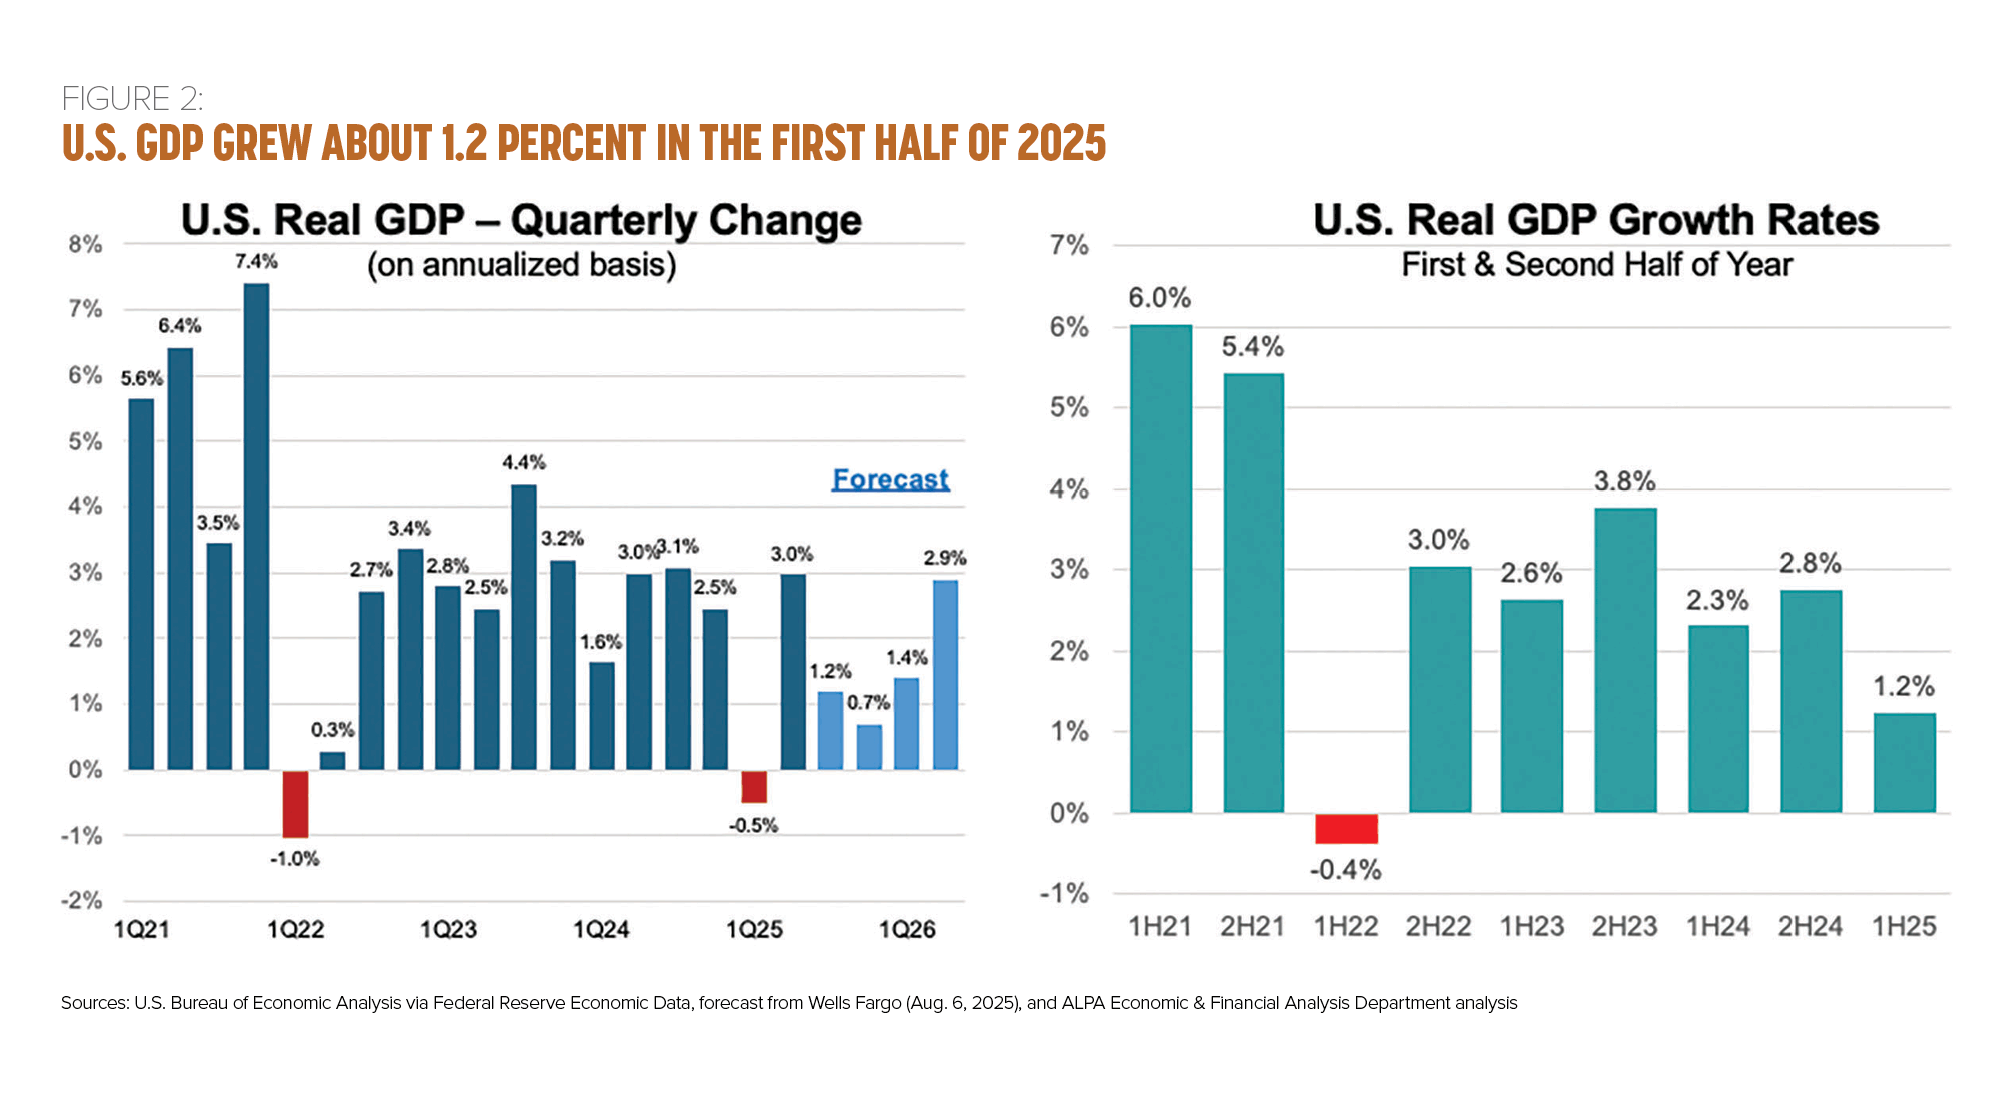
The first-half GDP numbers came in below the U.S. economy’s underlying, at-capacity growth rate of about 2 percent. Falling short of this mark usually means that economic demand isn’t strong enough to prevent unemployment from rising.
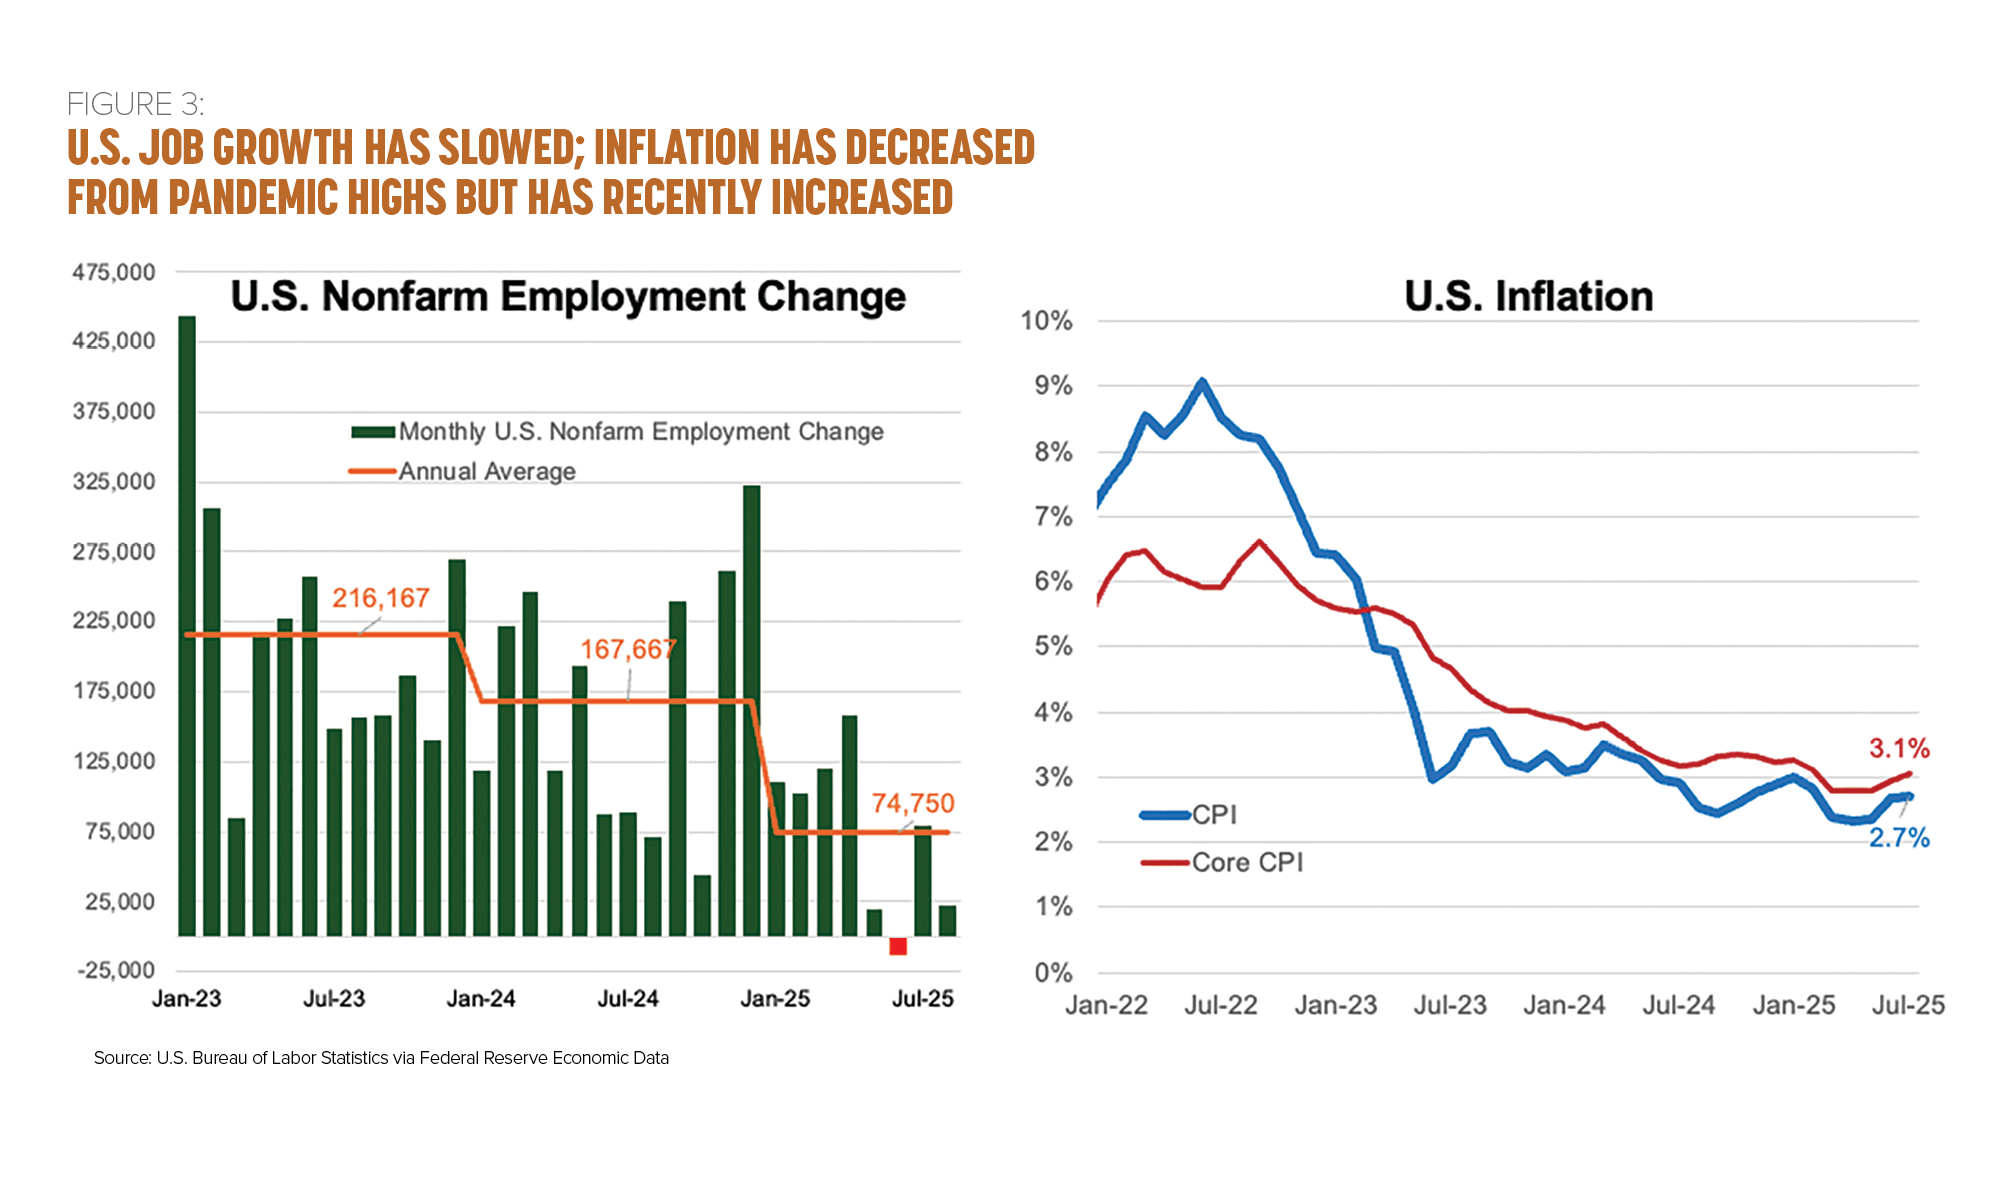
The shortfall in economic growth is reflected in the hiring numbers this year, as job growth has been well below that of the past two years. Through August, the U.S. economy had added just under 75,000 new jobs per month on average, a sharp decline from the nearly 168,000 jobs added per month in 2024 and the more than 216,000 jobs added per month in 2023 (see Figure 3). And the trend this year is for a further slowdown, as only about 29,000 jobs were added on average over the past three months.
In August, the U.S. unemployment rate rose to 4.3 percent, the highest percentage since October 2021. This puts the unemployment rate at the top end of the range the Federal Open Market Committee considers to be consistent with its “maximum employment” mandate.
The rate of change in consumer prices, the Consumer Price Index (CPI), has come down significantly from the levels seen during the pandemic (see Figure 3). In July, the CPI grew 2.7 percent on a year-over-year basis. Excluding food and energy, price growth was higher. The so-called core index rose by 3.1 percent, the highest level since February. Although there was significant concern over the impact of tariffs on goods prices, it was mostly service-related categories that accounted for the firmer core reading in July.
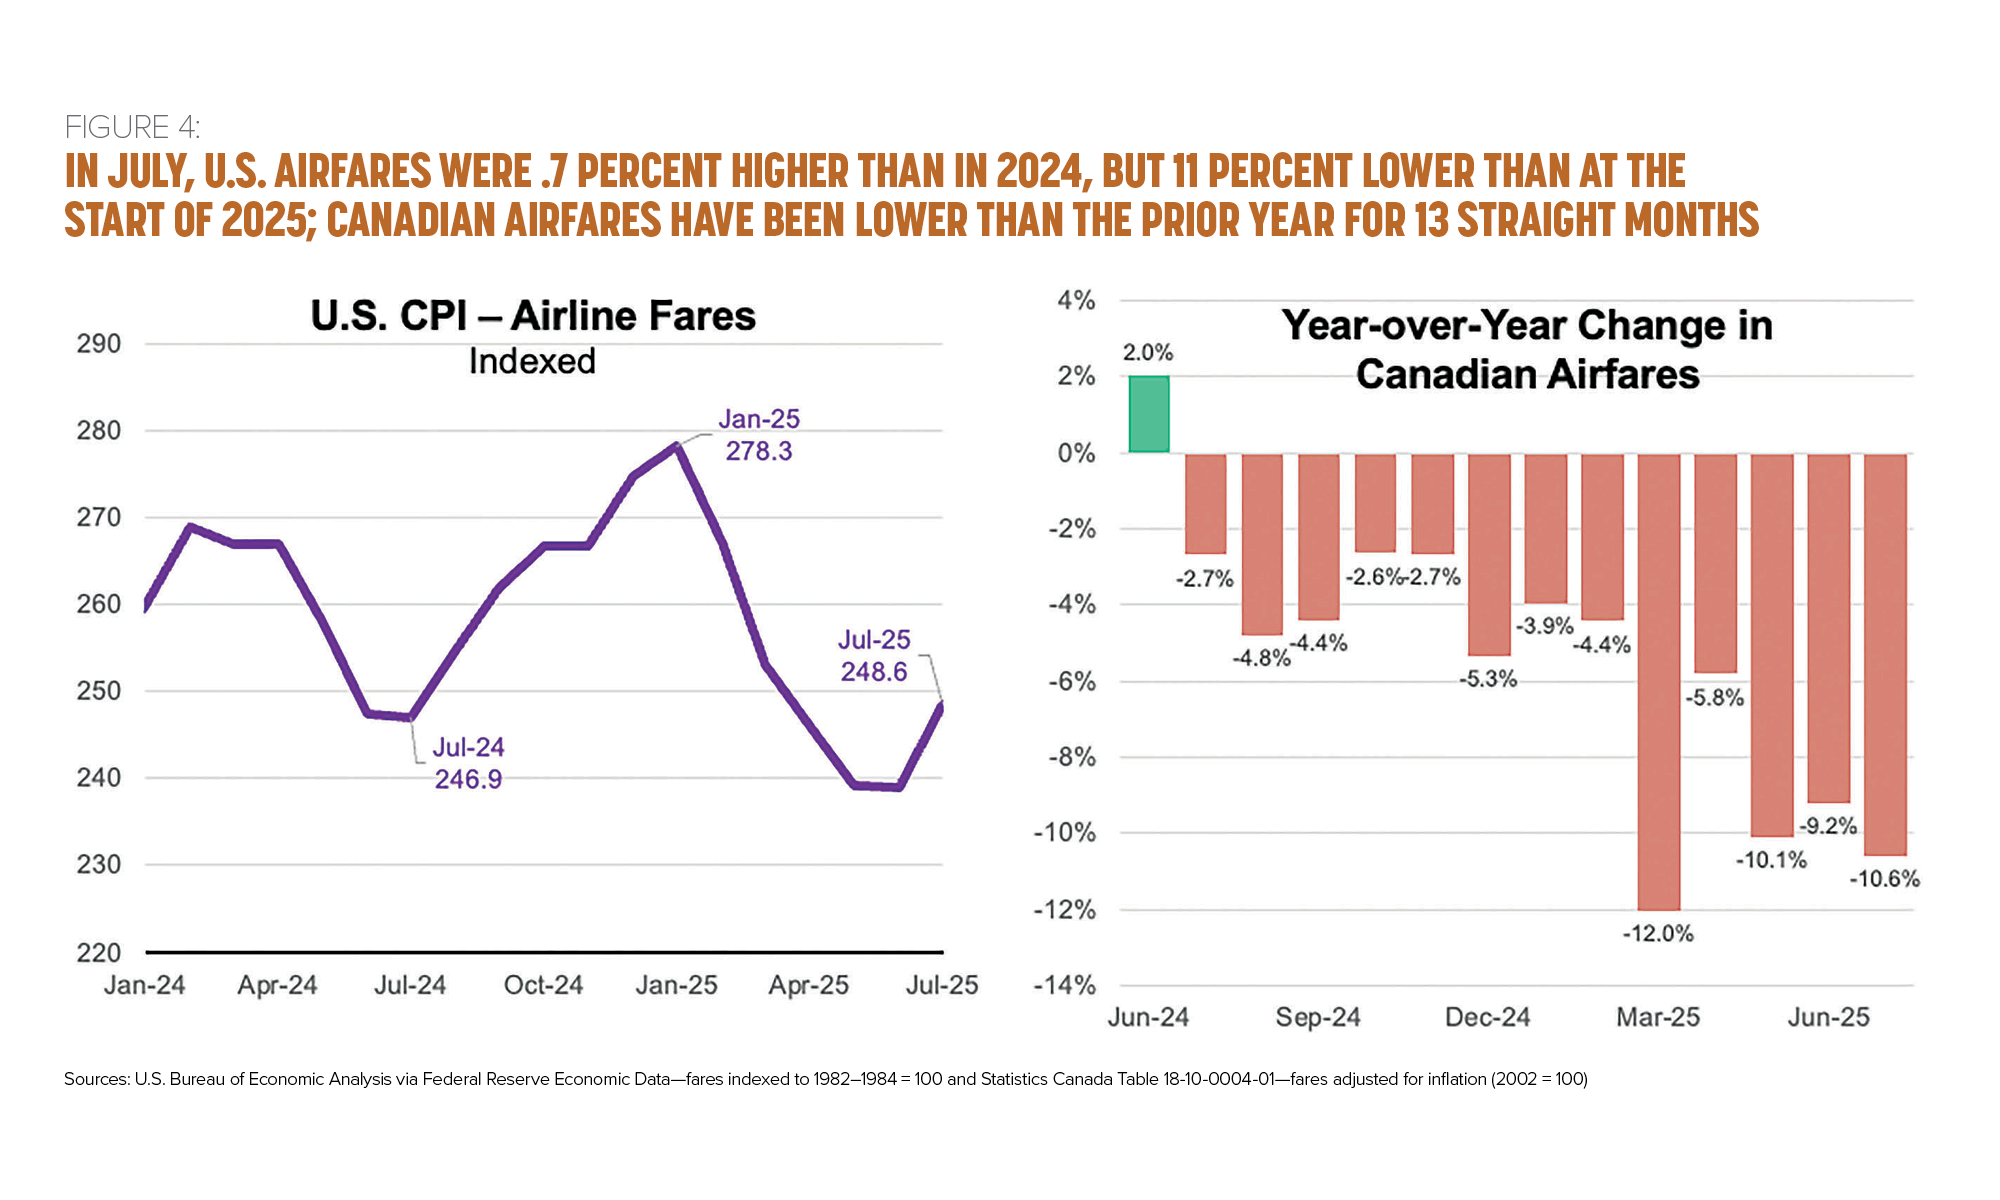
While overall inflation is trending upward, the same isn’t true for airfares. For the first half of the year, airfares were lower every month compared to last year. In July, fares were .7 percent above those seen last year, but 10.7 percent lower than they were at the start of the year (see Figure 4).
The overall CPI and employment reports illustrate the challenges facing the Federal Reserve, as its mission is to promote both price stability and full employment. The labor market is showing signs of lost momentum, which would indicate that the Fed should cut interest rates to boost economic activity. But inflation is still above the Federal Reserve’s target and is starting to drift in the wrong direction. If this trend persists, it could strengthen the case to maintain higher interest rates to keep prices in check.
The trends in the labor market and inflation directly affect the spending power of the consumer. In an environment with a slowing labor market (and by extension slowing wage growth) and rising prices, consumers are likely to shift away from discretionary spending, which includes air travel. Consumer sentiment fell 29 percent between January and May 2025 amid concerns about future inflation. Although sentiment rebounded in June, it remained 11 percent below that of the same period in 2024. Compared to the second quarter of 2024, real spending on air travel was down 3 percent in the second quarter of 2025. Compared to the first quarter of 2025, real spending on air travel fell 3.1 percent in the second quarter of 2025.
Canadian Economy Slows as Job Growth Stalls
Canadian GDP growth slowed markedly in the second quarter, coming in at minus 1.6 percent. This was on the heels of a strong 2 percent increase in the first quarter (see Figure 5).
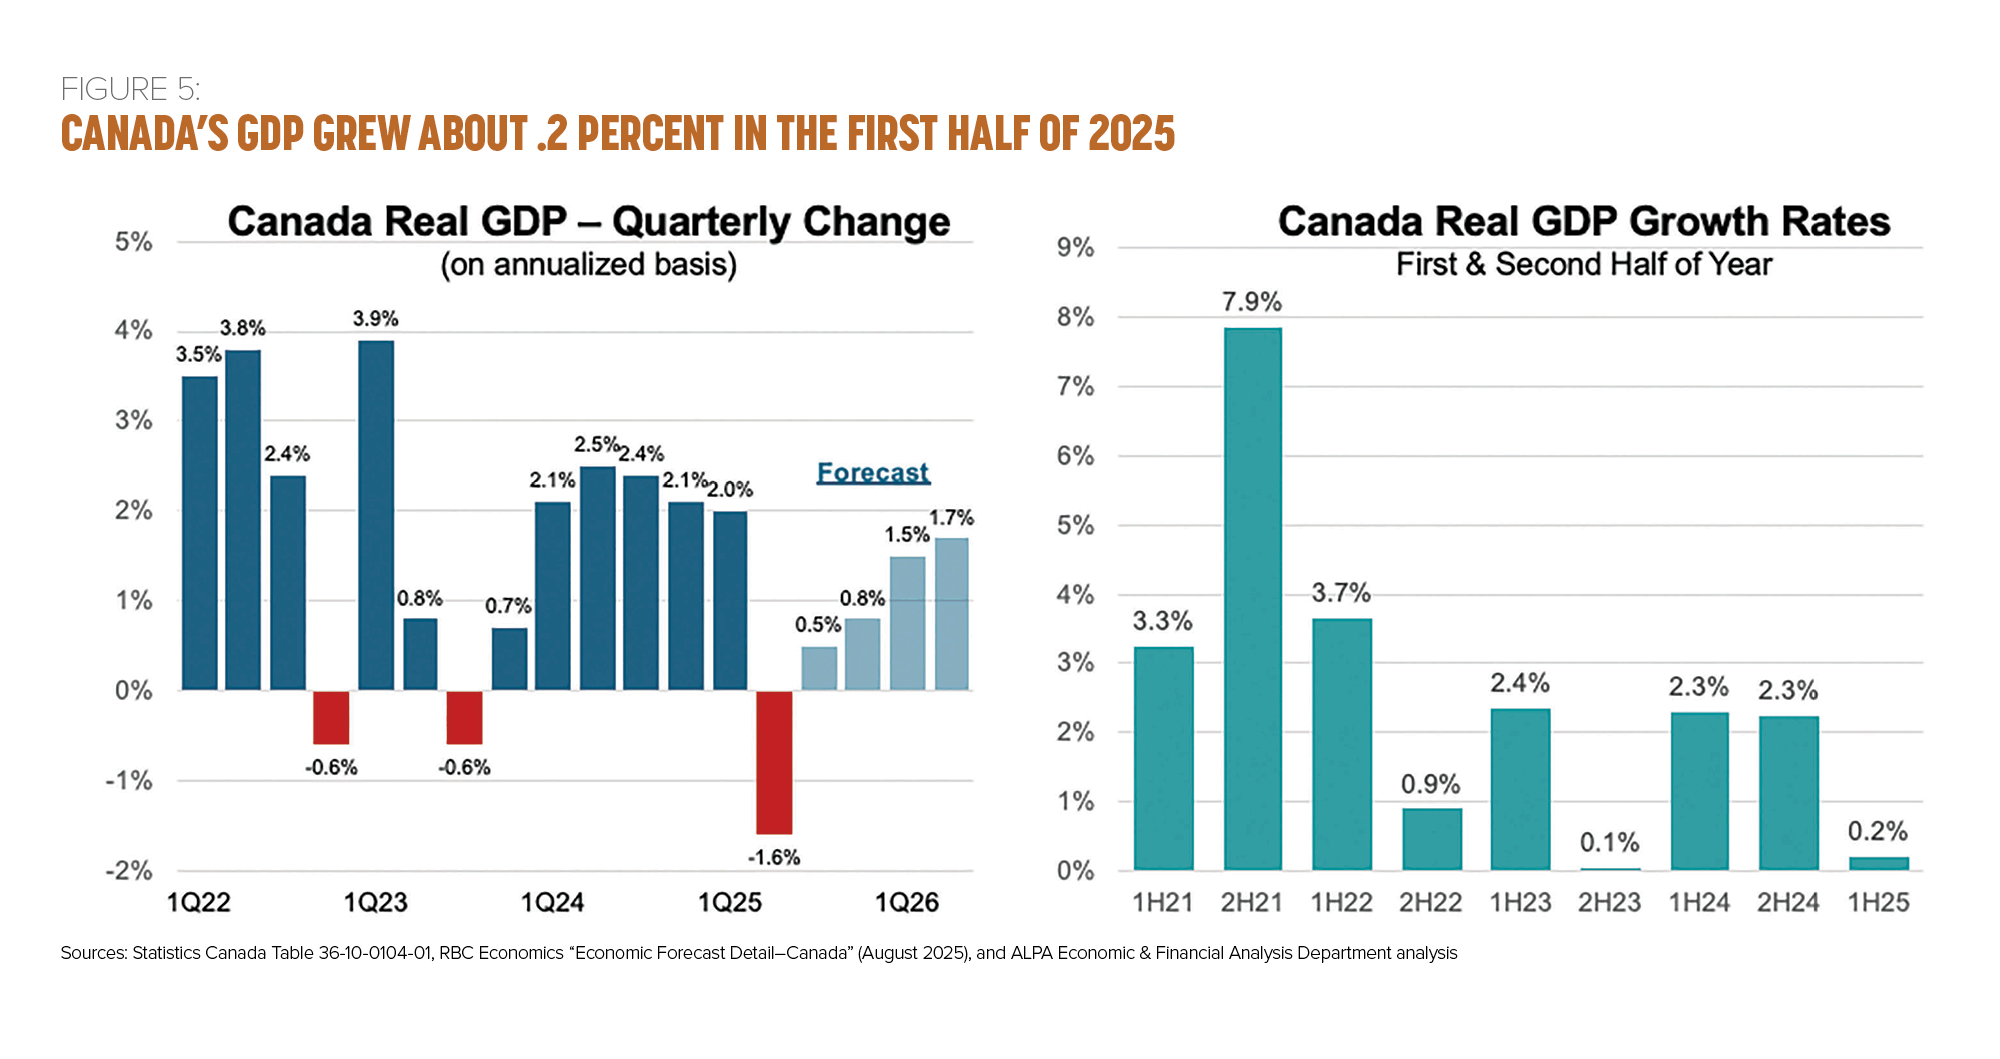
Similar to what was observed in the United States, the economic weakness was largely concentrated in heavily trade-exposed sectors. Most of the drop in the second-quarter GDP came because of a decrease in exports, tied to a broad-based fall in U.S. imports after the surge in pretariff stockpiling in the first quarter. Excluding the impact of trade and inventories, domestic demand performed well in the second quarter, expanding 4.5 percent after increasing just .5 percent in the first quarter.
Because of the large swings in trade, as with the U.S. statistics, a better way to assess the strength of the economy is to average the results of the first two quarters (see Figure 5).
Through the first eight months of 2025, Canadian employment grew only by a total of 37,500 jobs (see Figure 6). The weakness in the Canadian job market is primarily concentrated in the sectors exposed to trade, with employment in manufacturing, transport, and warehousing together shrinking by about 42,000 jobs in August.
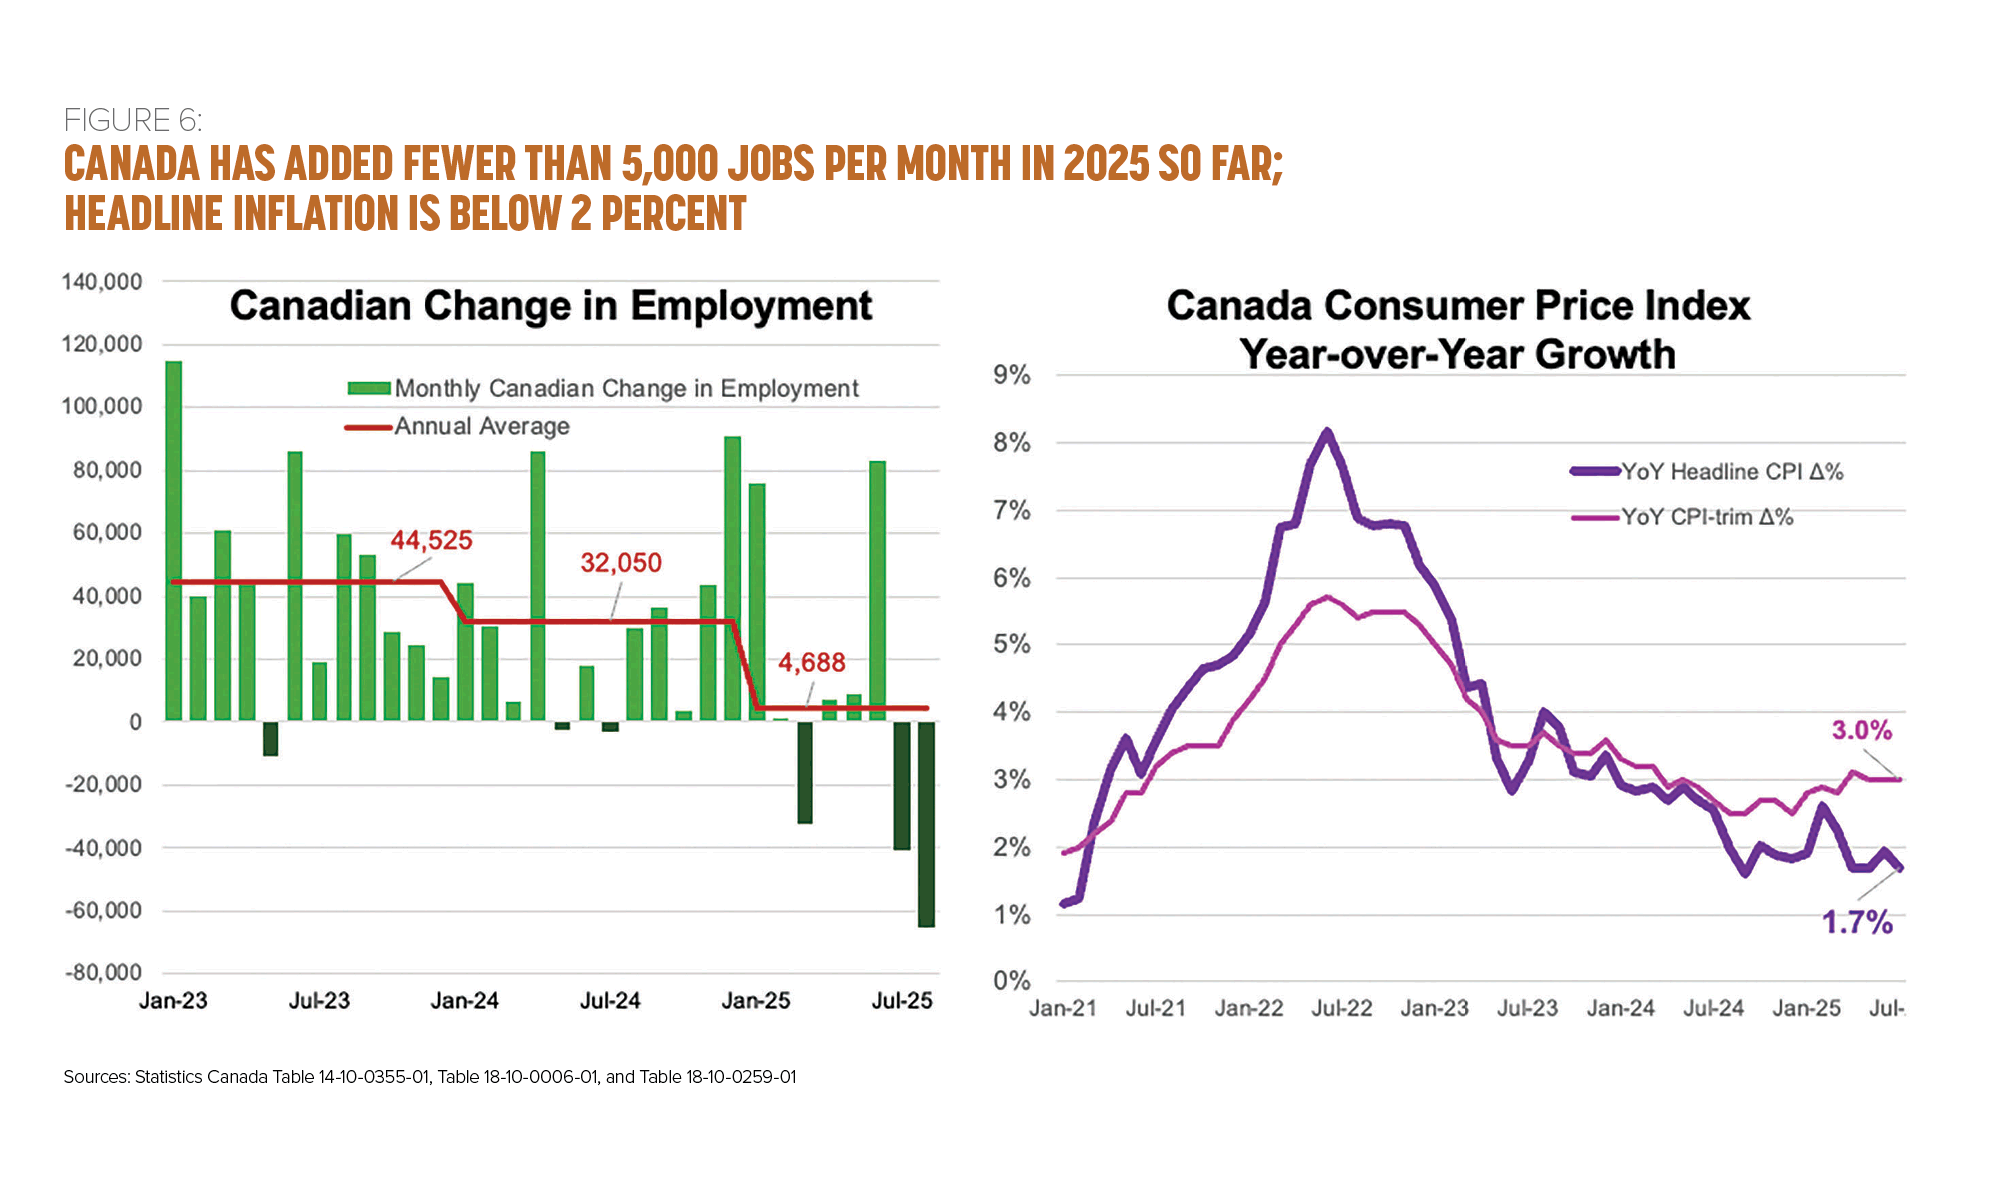
The unemployment rate rose to a new cycle high of 7.1 percent. This increase would have been worse if not for 31,200 fewer workers in the labor force.
Inflation pressures in Canada have recently eased. Headline CPI was still biased lower by the removal of consumer carbon surcharges in April, but the slowing to 1.7 percent in July from 1.9 percent in June was mostly reflecting easing in underlying inflation pressures. Food inflation continues to run hot, edging 3.3 percent higher in July. Conversely, energy inflation was down 10.4 percent in July. Excluding food and energy, CPI growth stood at 2.6 percent in July.
Looking at airfares, July marked the 13th straight month that fares were lower compared to the same month in 2024. For the first seven months of 2025, the average airfare was 8.2 percent lower than for the same time in 2024 (see Figure 4).
The Bank of Canada’s preferred core measures focus on the CPI-trim measure, which excludes the effects of the consumer carbon surcharge change. CPI-trim has held steady at around 3 percent year over year since April but remains significantly above the bank’s 2 percent inflation target (see Figure 6).
U.S. Tariff Policy Feels Like a Roller-Coaster Ride
The current U.S. tariff policies implemented by the Trump administration are having an impact on the economy and by association the airline industry. The effective tariff rate has experienced substantial fluctuations in 2025. Starting at 2.4 percent in early January, the rate surged to a peak of 28 percent in April. The rate has dropped some, and, according to the Yale Budget Lab, at the end of August, the average effective tariff rate was 17.4 percent—the highest since 1935 (see Figure 7).
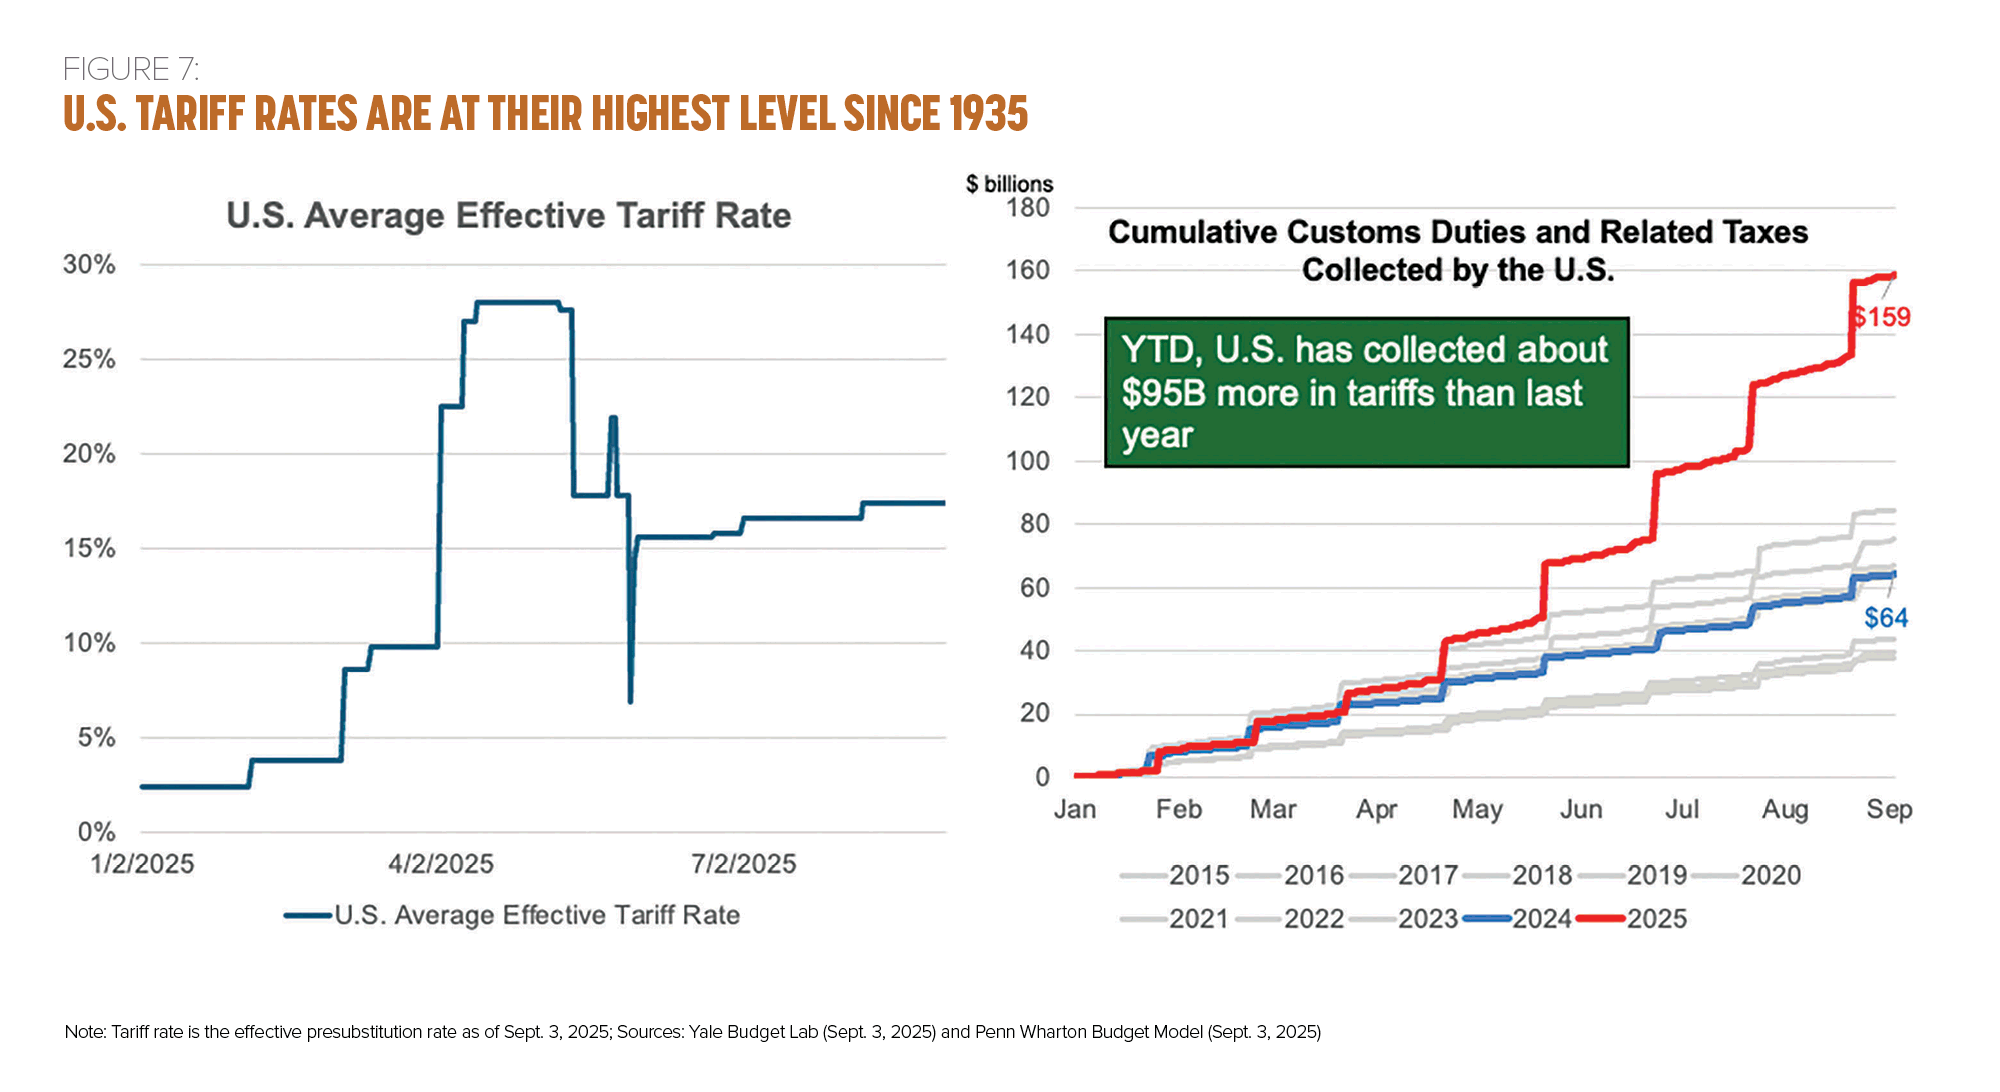
While the administration has claimed that exporters will “eat” the tariff, the evidence to date doesn’t support this claim. U.S. importers always pay the import tariffs (see Figure 7). Thus, the only way for exporters to eat the tariff is by lowering their price, thereby offsetting the effects of the tariff. But looking at the U.S. Bureau of Labor Statistics’ import price index, prices for imports haven’t gone down. In fact, they’ve increased since the beginning of the year.
If foreigners aren’t paying for the tariffs, then why haven’t prices surged? Imports account for only about 11 percent of U.S. GDP, so the impact is limited, and many businesses have absorbed the cost of tariffs by reducing their profitability. In addition, numerous businesses and retailers accelerated their purchases ahead of the tariffs, thereby providing an inventory buffer.
Looking at the impact of U.S. tariffs on Canada, according to the Peterson Institute for International Economics, tariffs collected on Canadian goods have gone from $43 million in January to $709 million in June—an increase of more than 16 times. The overall rate, however, is still quite low. Data from the U.S. Census Bureau showed that 88 percent of Canadian exports to the United States crossed the border duty free in July, as most of the goods traded to the United States are compliant with the United States-Mexico-Canada Agreement. As a result, Canada has the lowest average effective tariff rate (approximately 3 percent) of any major U.S. trading partner.
For the U.S. aviation industry, the initial effects of the tariffs caused airlines to become creative in how they dealt with the impact of higher prices. Delta, for example, used a loophole in the law by registering new Airbus aircraft in Japan and then reclassifying the aircraft as “used” upon arrival to the United States. Fortunately, according to Aviation Week, the EU and United States have reached a major trade agreement restoring zero tariffs on aircraft and aerospace components. Similarly, Reuters reported that U.S. tariffs on Brazilian aircraft have been lifted. This development could signal a positive trend for the treatment of aircraft, engines, and parts in other trade agreements.
U.S. Mainline Airlines: First Half of 2025 Diverging Performance Amid Volatility
The U.S. mainline passenger airline industry is navigating a volatile revenue environment shaped by mixed demand trends, economic uncertainty, and geopolitical pressures. Despite a strong start to the year, with 2 percent revenue growth in the March quarter and an operating profit achieved in what is typically the weakest period, the industry has faced mounting headwinds. In April, several major carriers, including Alaska, American, Delta, and Southwest, withdrew their full-year 2025 financial guidance, citing weakening leisure demand and uncertainties regarding U.S. tariff policy.
In the first half of 2025, the U.S. passenger airline industry faced demand challenges from a combination of operational incidents, new tariff policies, unfavorable weather, and weakness in government travel, contributing to a broader market softening. In early 2025, the Transportation Security Administration throughput growth outpaced domestic capacity; however, in March and April, as capacity growth accelerated to 3 to 4 percent, throughput weakened and the supply-demand gap widened, a trend that persisted into May and June.
Domestic capacity (measured in available seat miles) grew 1.5–2 percent from May through July, creating a supply-demand imbalance. Airlines have adjusted their schedules to address this. As a result, domestic capacity in August and September was flat compared to last year, a move that is bringing the market closer to equilibrium. Year-over-year capacity growth in the fourth quarter is expected to moderate across both network carriers and low-cost/ultra-low-cost carriers.
Internationally, outbound travel from the United States to Europe has remained strong, up 4.9 percent through the first seven months of this year. Meanwhile, inbound travel from Europe has weakened, down 2.3 percent over the same time frame, according to APIS I-92 data.
U.S. passenger airlines reported mixed financial results for the first half of 2025, continuing a trend seen in recent years: industry profits are largely concentrated among a few carriers, primarily full-service airlines. Revenue diversity and exposure to high-margin segments are increasingly seen as key drivers of financial performance, with revenue generation now a greater differentiator among airlines than capacity management. In the June quarter, industry operating profit was $5 billion, down 22 percent year over year, while pretax profit totaled $4.1 billion, down 27 percent. American, Delta, and United together accounted for 93 percent of the industry’s operating profit and 95 percent of the pretax profits for the quarter.
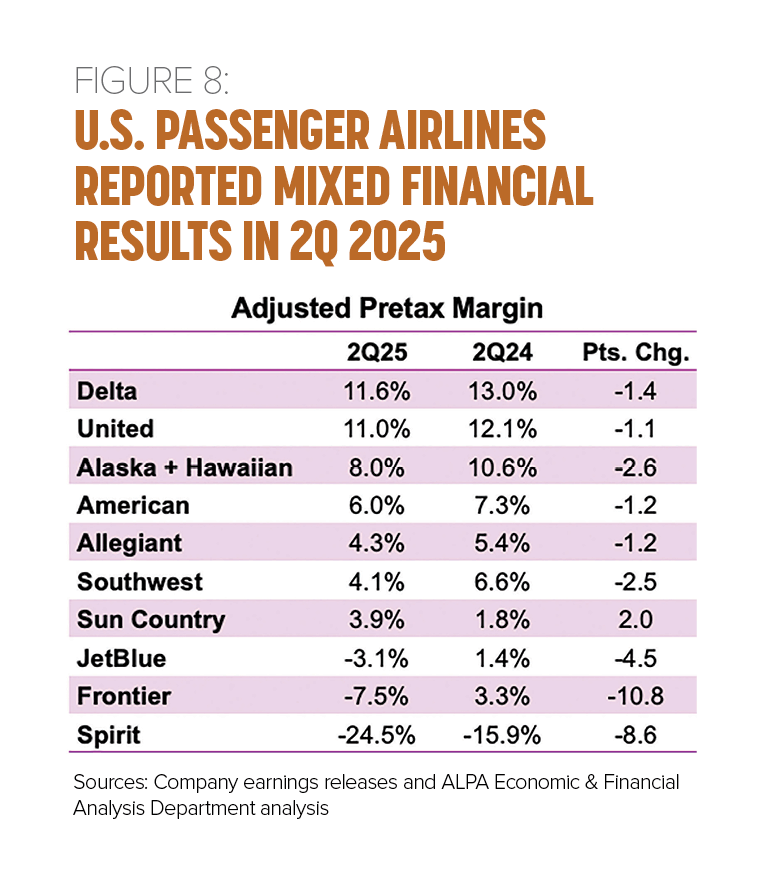
Both Delta and United achieved adjusted pretax margins above 11 percent (compared with roughly 6 percent for American). These two carriers are anticipated to generate 74 percent and 80 percent, respectively, of industry operating and pretax profits (see Figure 8). Their competitive edge is likely to depend less on expanding capacity and more on disciplined revenue management and the ability to serve the premium air travel market, which has outperformed the low-fare sector over the past several years. Despite expected volatility in the second half of 2025, Delta and United are likely to maintain their financial leadership (see Figure 9), delivering strong earnings and cash flow.
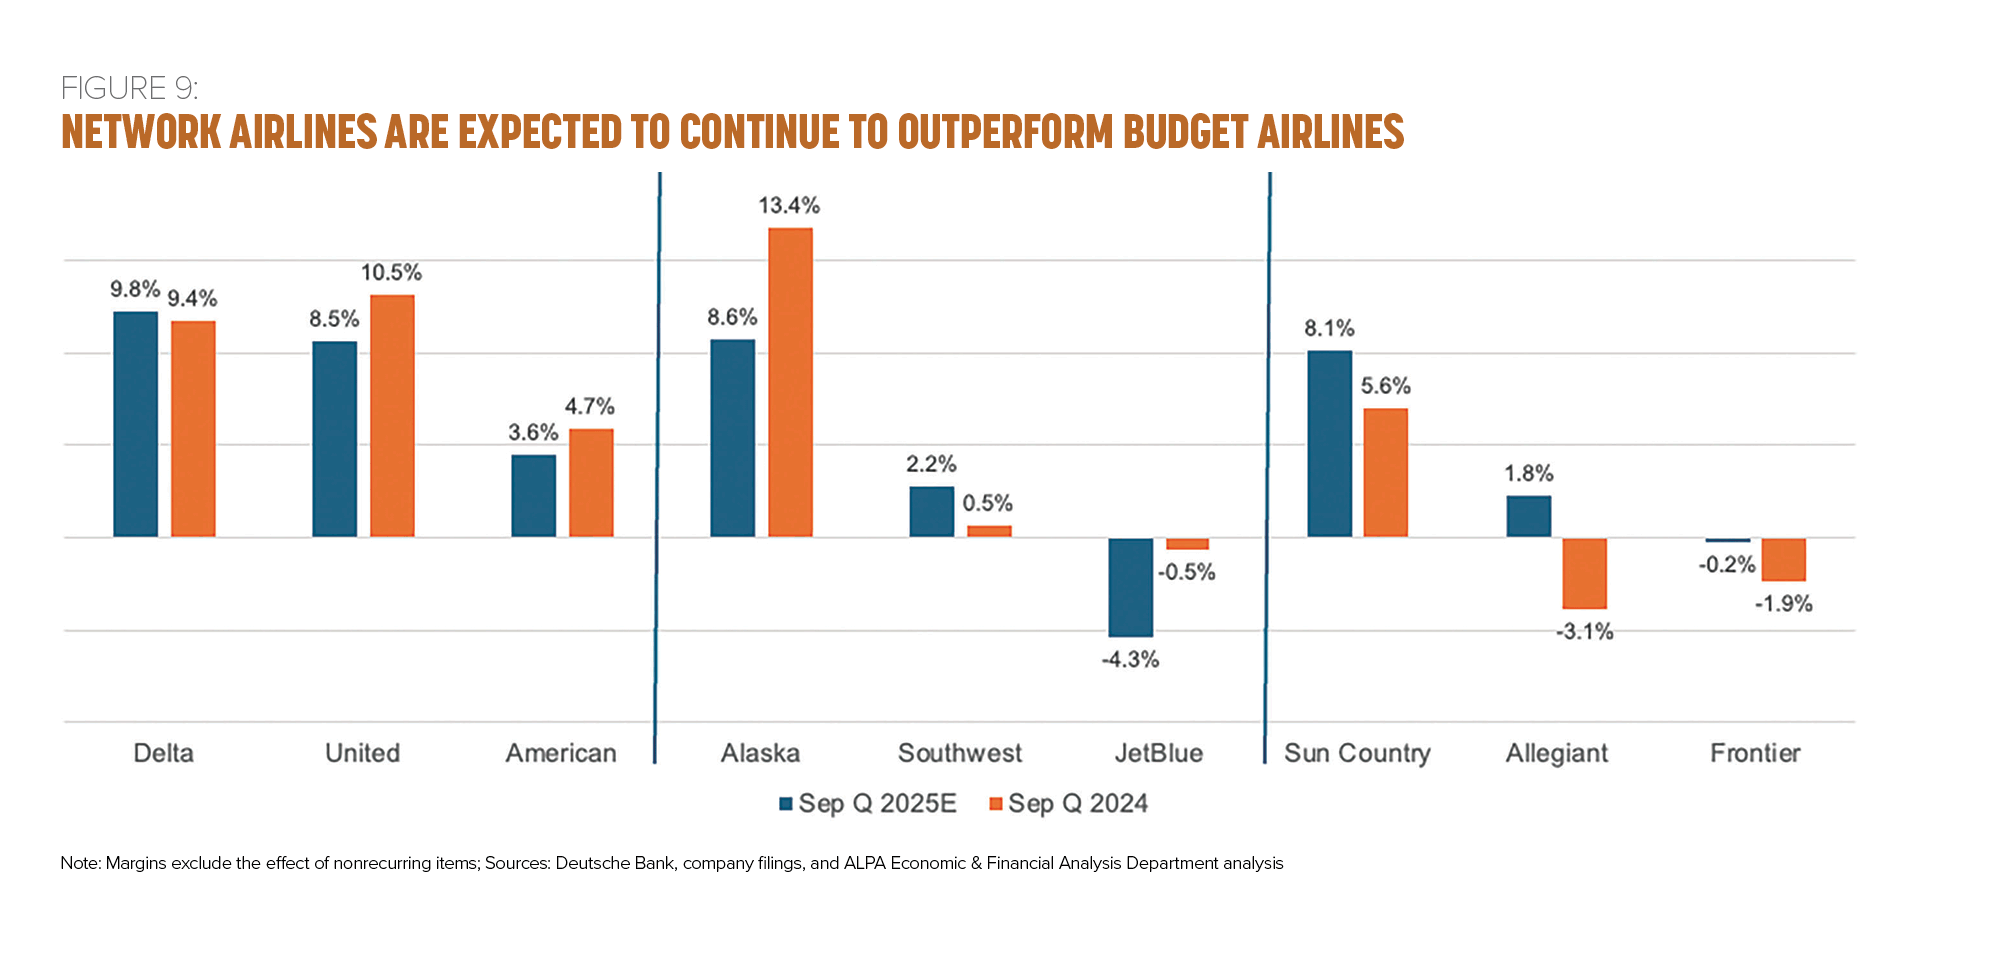
Some low-cost carriers remained profitable in the June quarter, such as Allegiant and Sun Country, although their margins were roughly about one-third of those achieved by Delta and United. However, other low-fare carriers continue to underperform, including Frontier and JetBlue, with both reporting losses in what is typically one of their strongest periods.
In addition, Spirit has filed for Chapter 11 bankruptcy twice within a year, most recently this August, citing the need to address its cost structure, soft leisure travel demand, heavy debt, and unsuccessful prior restructuring. As a result, the airline has reduced services and routes, while competitors like Frontier and United are expanding into some of Spirit’s current and former markets.
The challenges facing these carriers are well established: an oversaturated competitive landscape and frequent market entry and exit that erodes brand loyalty. Most critically, low-cost carriers appear to have a revenue problem. While many have introduced initiatives to bolster revenue, it takes time for new products to gain traction with consumers. Their difficulties are compounded by full-service carriers increasingly offering highly competitive fares, such as basic economy, to offset weaker performance in other revenue streams like corporate travel.
Cost pressures remained a central theme for U.S. mainline carriers in the first half of 2025, while jet fuel prices provided a tailwind to airlines. Maintenance costs have risen amid supply-chain disruptions, limited parts availability, and extended turnaround times, while airport fees, insurance, and landing charges add further structural cost pressures. These expenses are expected to remain elevated in the second half of the year, prompting carriers to pursue productivity initiatives, such as exploring artificial intelligence (AI) to optimize crew scheduling and network planning.
Airlines are already using AI in numerous ways. Alaska is using it to improve its aircraft turn processes. American is using AI to help estimate how many crewmembers are needed to cover open flights and machine learning to predict block times. United is using it to update labor contracts.
In the second half of 2025, the airline industry is expected to face continued revenue and earnings volatility, driven by shifting demand dynamics and persistent economic uncertainty. Demand remains bifurcated, with premium travel holding steady even as surveys show that lower-income households are scaling back discretionary travel spending. In this environment, industry profitability is projected to soften, with third-quarter operating profit estimated at $3.5 billion (down 3 percent year over year) and pretax profit at $2.6 billion (down 11 percent), equating to operating and pretax margins of 5.9 percent and 4.4 percent, respectively. However, carriers also highlighted a changing seasonal trend, noting that fourth-quarter earnings should be stronger, while third-quarter results were temporarily weighed down by the delayed effects of weaker second-quarter demand.
Positive catalysts from U.S. fiscal and monetary policies and the easing of trade tensions could help drive discretionary spending moving into 2026. However, negative catalysts include another spike in Middle East conflicts, ongoing uncertainty weighing on business investment, and increasing unemployment due to slowing economic growth.
Canadian Passenger Travel Patterns Impacted by U.S. Policies
Relations between Canada and the United States became strained when President Trump vowed to make Canada a U.S. state and when he imposed steep tariffs on some Canadian exports. This tough rhetoric, along with a stronger U.S. dollar (relative to the Loonie), has affected Canadians’ travel patterns.
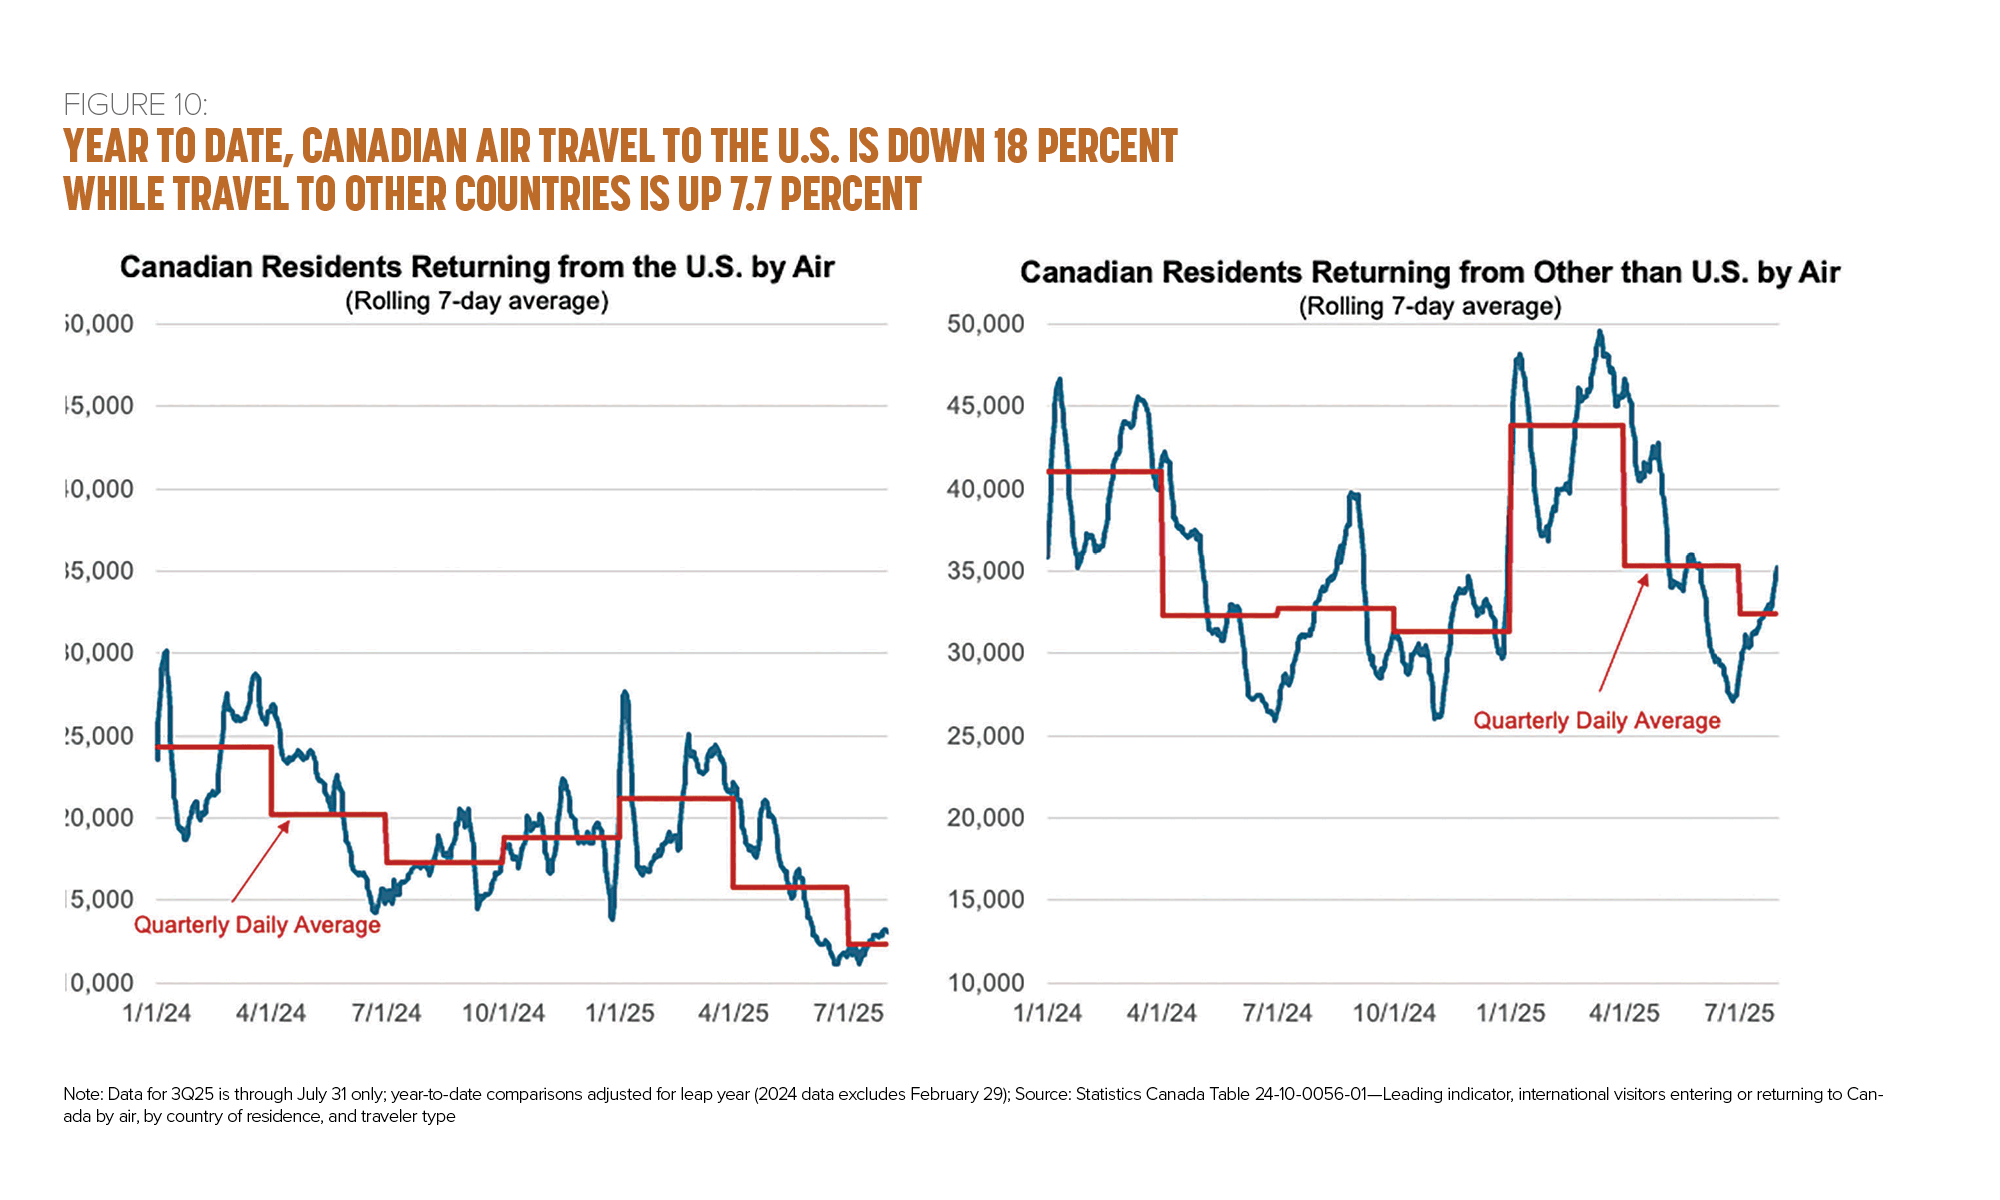
Focusing on air travel, through July, Canadians have taken approximately 816,000 fewer air trips to the United States than over the same period in 2024—a decrease of 18 percent. At the same time, Canadians have taken 7.7 percent more trips to countries other than the United States—an increase of nearly 581,000 air trips (see Figure 10).
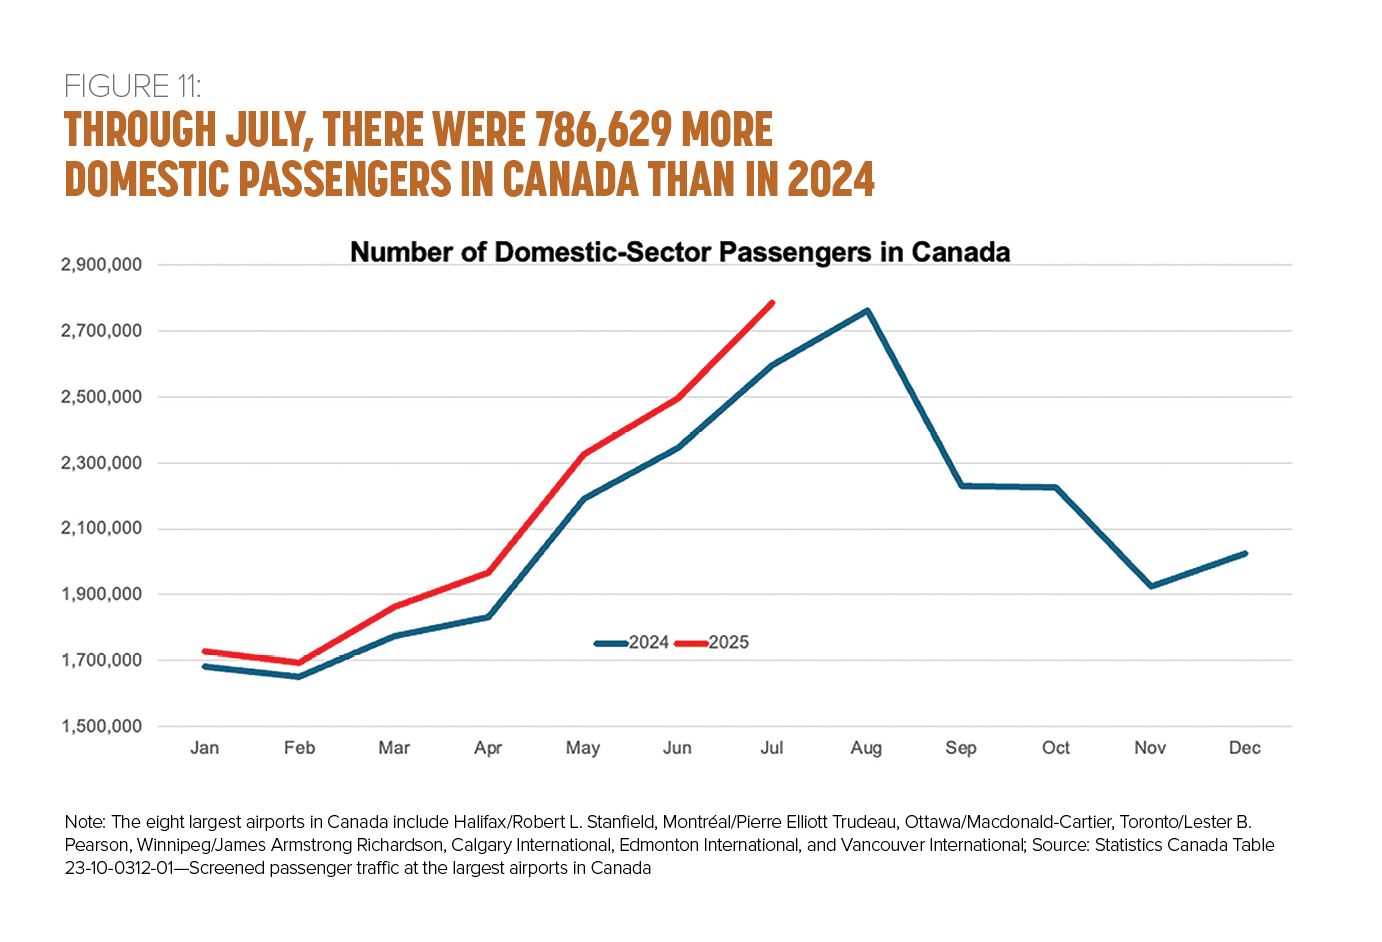
While overall international air travel by Canadian residents is down 1.9 percent (approximately 236,000 fewer trips), the number of domestic segment passengers is up 5.6 percent (about 787,000 more passengers) through July (see Figure 11).
Canadian carriers have adjusted their capacity accordingly. For 2025, Canadian airlines are scheduled to operate nearly 2.8 million more domestic seats than they operated in 2024—a 4.9 percent increase. WestJet is adding the most seats, more than 1.3 million for the year. However, Air Canada remains the largest domestic carrier, offering 25.1 million domestic seats in 2025 compared to WestJet’s 17.5 million seats—over 44 percent more domestic seats than its next largest competitor (see Figure 12).
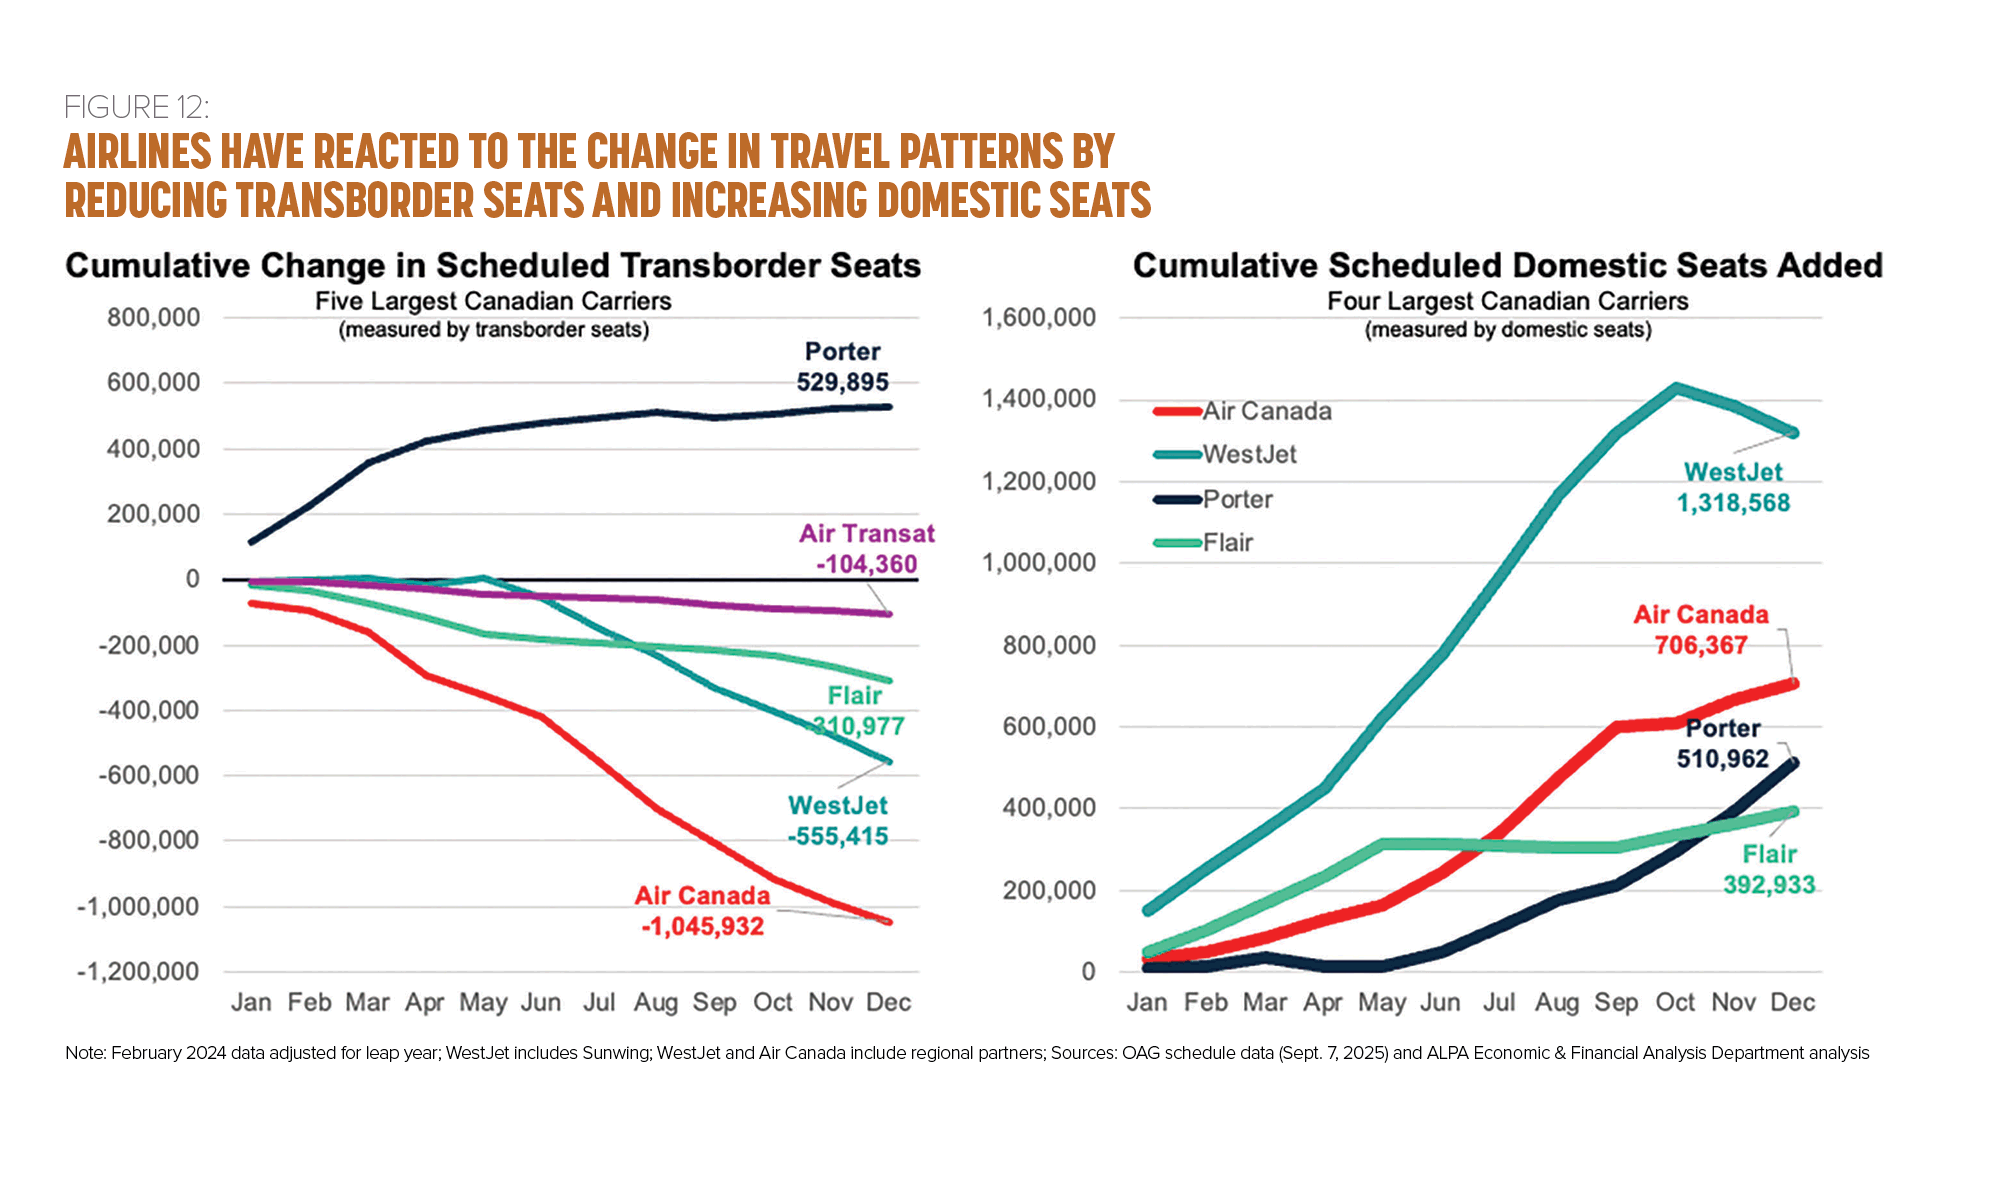
Meanwhile, Canadian operators will offer nearly 1.7 million fewer transborder seats in 2025 than they did in 2024, a decrease of 6.3 percent. Porter is the only Canadian carrier growing its transborder capacity, increasing its transborder seats by more than 25 percent (see Figure 12).
Jet Fuel Prices Have Been a Tailwind for the Industry
Year to date through the beginning of September, U.S. Gulf Coast jet fuel prices have averaged $2.12 per gallon, which is 36¢ lower than the $2.48 per gallon average seen for the same time frame last year. The 11 largest U.S. passenger airlines (on a consolidated basis) consumed an estimated 12.2 billion gallons of fuel (on a consolidated basis) during this time, which represents a fuel expense saving of about $4.4 billion for the industry so far (see Figure 13). Canadian carriers are also realizing tailwinds from lower fuel bills, albeit at a lessor amount than their U.S. counterparts due to foreign exchange volatility.
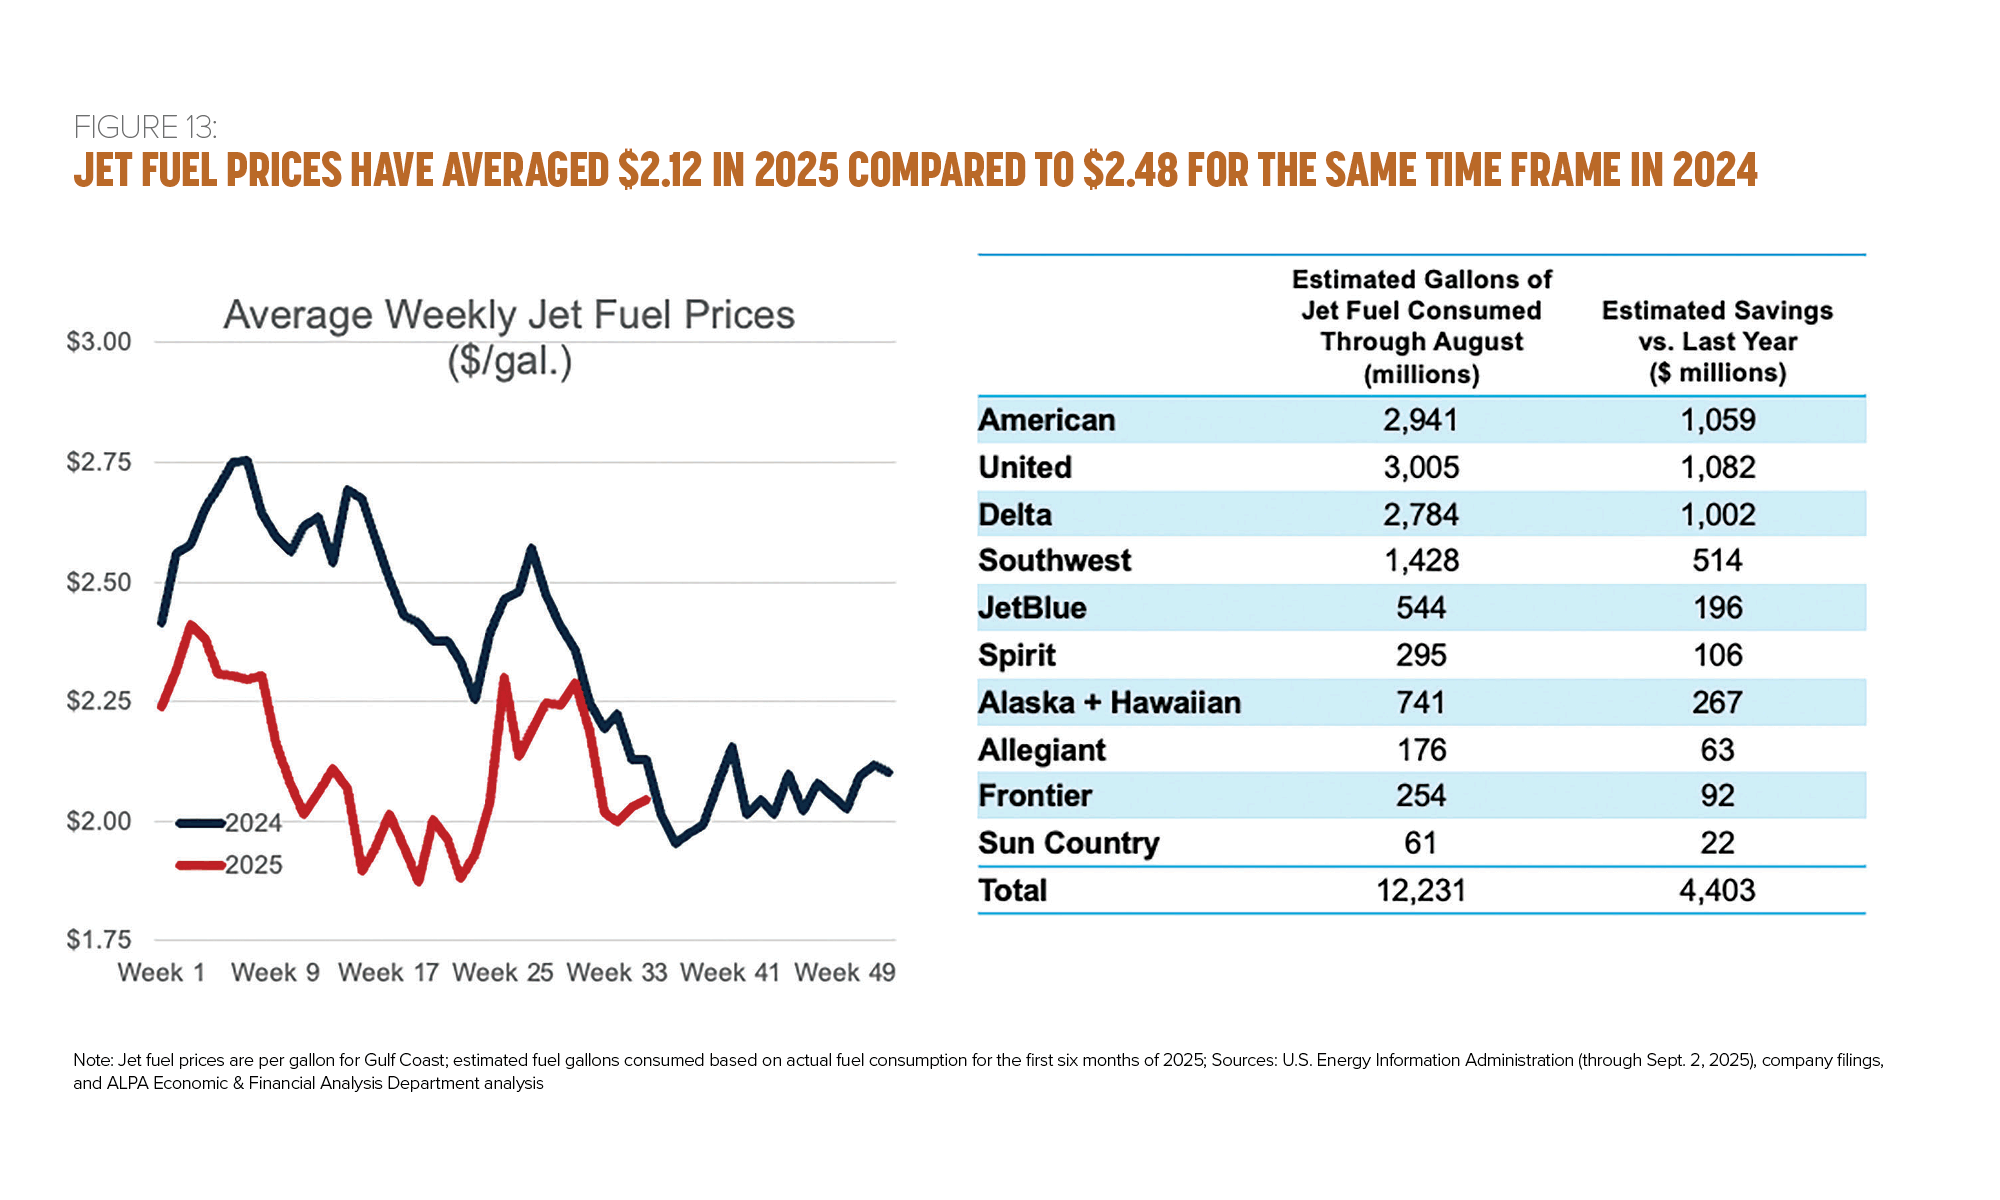
Lower jet fuel prices this year are due to a combination of lower crude oil prices and lower crack spread (the difference between the cost of jet fuel and crude oil). West Texas Intermediate crude oil prices have averaged $67.74 per barrel through the first eight months of this year, compared to an average of $79.57 over the same time period last year. In addition, the crack spread has fallen from $24.45 in 2024 to $21.13 in 2025.
The U.S. Energy Information Administration (EIA) is forecasting further decreases in the price of crude oil, based largely on high oil inventory levels following OPEC+ members’ decision to accelerate the pace of production increases. As a result, EIA’s Short-Term Energy Outlook (published on August 12) is forecasting jet fuel prices in the low $2 range for the remainder of this year and into next year.
2025 Showing Improvement for U.S. Regional Airlines, but Headwinds Remain
With the advent of the hub-and-spoke model after deregulation in 1978, regional airlines have primarily served as affiliates of major network carriers, connecting smaller airports with larger airline hubs. According to the Regional Airline Association’s most recent annual report, in 2023, 63 percent of U.S. airports with scheduled passenger service were served only by regional carriers.
While the regional industry’s share of total scheduled passenger service has been slowly declining for more than a decade, the COVID-19 pandemic shook things up even further. Figure 14 illustrates some of the characteristics of regional service over the last several years.
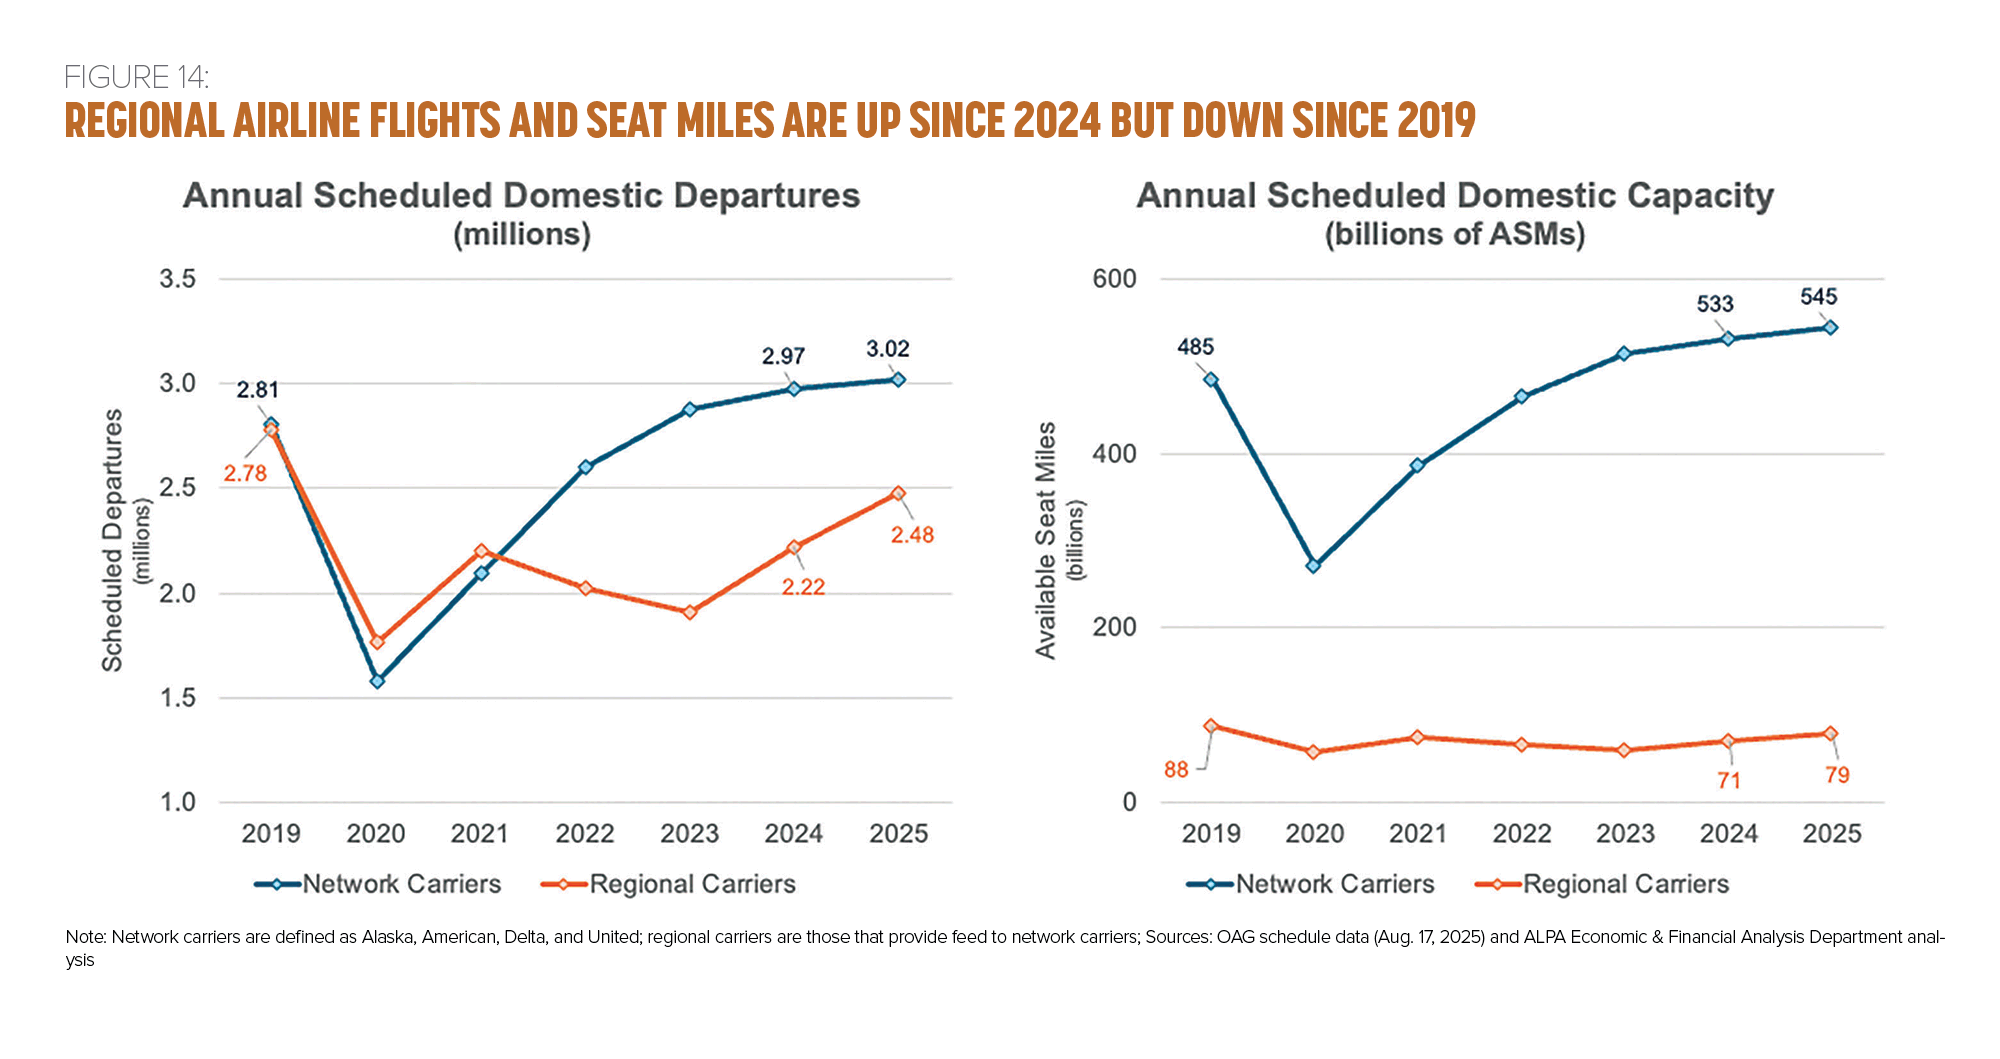
Looking back to 2019 and focusing on domestic operations, the number of scheduled flights (departures) was similar for both network carriers and their regional affiliates. Conversely, the number of available seat miles (ASMs) scheduled by regional carriers was less than 20 percent of mainline scheduled ASMs. This difference highlights the fact that regional airlines operate smaller aircraft with fewer seats, typically flying shorter but more frequent flights.
Looking at 2025 domestic operations, while regional airlines’ scheduled departures and ASMs increased by 11.6 percent and 11.9 percent, respectively, over 2024, regional flights and ASMs each remain 10.9 percent and 10.5 percent, respectively, below their 2019 levels. This isn’t true for network carriers. While network carriers’ scheduled departures and ASMs increased only 1.5 percent and 2.3 percent, respectively, over 2024, their departures and ASMs are above 2019 levels by 7 percent and 12 percent, respectively.
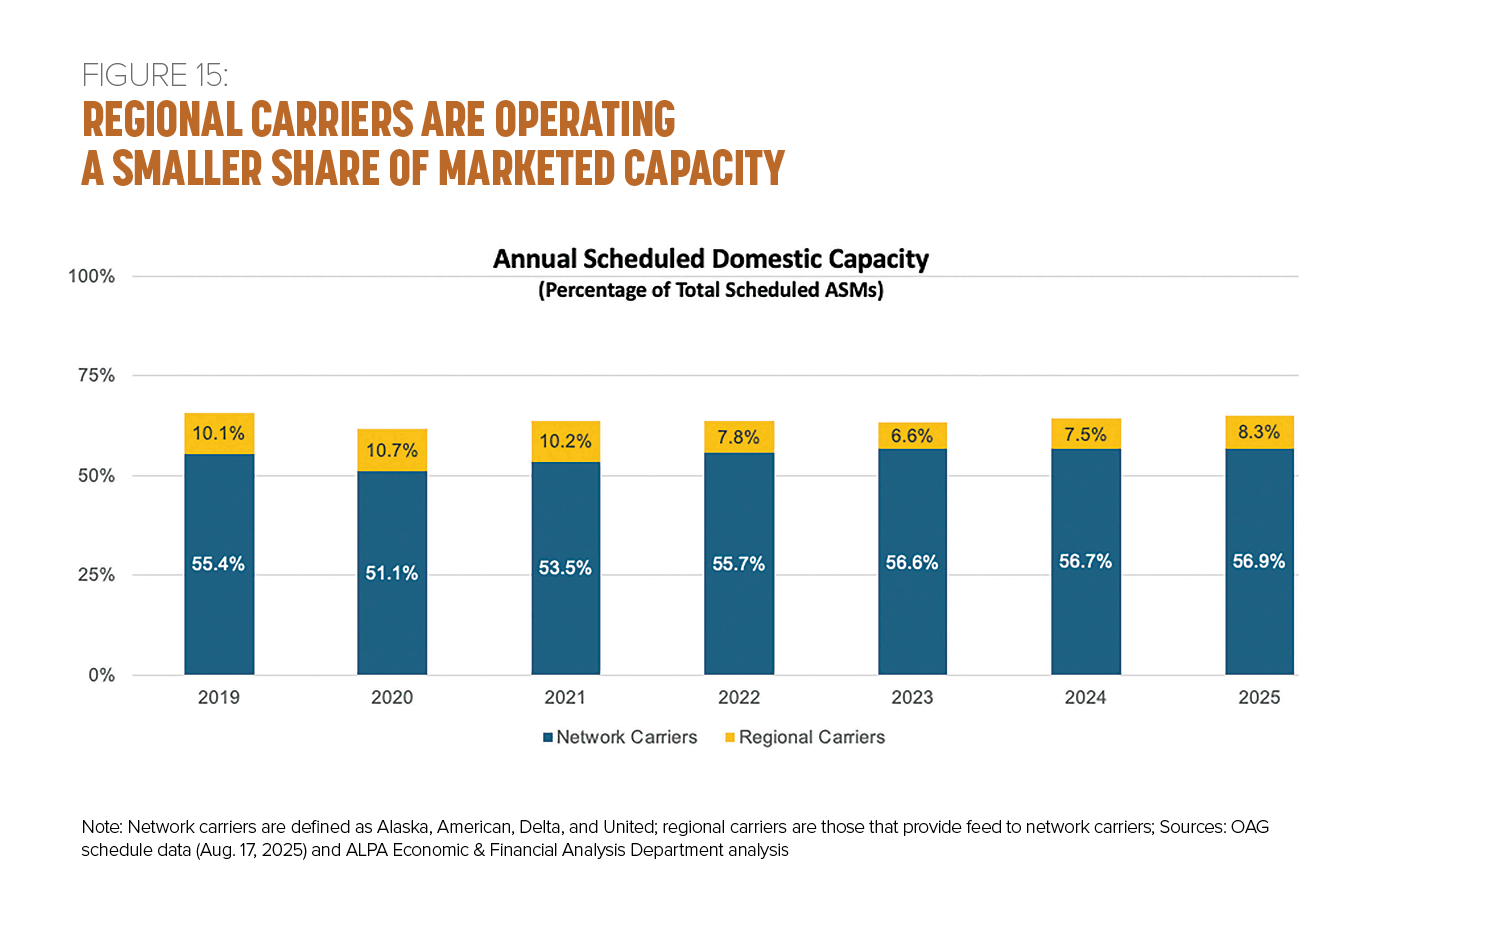
The relative decline in regional carrier ASMs compared to network carrier ASMs suggests that network carriers are continuing to bring more of their flying in house (see Figure 15). In both 2019 and 2025, total ASMs offered (i.e., marketed) by Alaska, American, Delta, and United—including their regional affiliates—comprised more than 65 percent of all domestic capacity. During this time, however, the share of domestic ASMs flown by mainline network carriers increased from 55.4 to 56.9 percent, while the share flown by regionals fell from 10.1 to 8.3 percent.
In 2025, network carriers are scheduled to directly operate 60.2 billion more domestic ASMs than in 2019, while their regional affiliates are scheduled to operate 9.3 billion fewer domestic ASMs.
Much of this loss of regional capacity has been attributed to the pandemic-era reduction in flights to smaller markets, combined with the relatively higher cost per passenger mile of operating regional jets. Mainline network carriers responded to these economic challenges by reducing the frequency to some smaller markets and replacing regional jet service with larger narrowbody aircraft. It remains to be seen whether the increases in regional airline capacity we’ve seen in 2024 and 2025 are the start of a turnaround or simply a recovery from the worst impacts of the pandemic.
The number of regional airlines operating as regional affiliates continues to shrink in 2025. In April, American terminated its contract with Air Wisconsin. It was also announced in April that Mesa will be merging with Republic, with the combined airline operating under the Republic name.
Apart from the wholly or partially owned regional affiliates of Alaska (Horizon Air), American (Envoy Air, Piedmont, and PSA), Delta (Endeavor Air), and United (CommuteAir), only GoJet, Republic, and SkyWest remain as independently owned U.S. regional affiliates. It should be noted that this analysis only considers those regional carriers that operate as affiliates for network carriers. There are also several dozen smaller regional carriers operating independently and serving specific geographic areas. Their statistics aren’t included in this analysis.
Air Cargo Industry Is Facing Volatility and Uncertainty Due to Tariffs and Other Policy Changes
The air cargo industry includes both specialized freight carriers such as Air Transport International, FedEx Express, and Kalitta Air, as well as passenger airlines that transport third-party freight in the belly hold of their passenger aircraft. According to IATA, over the past two years, 55 percent of international air freight—measured by revenue ton miles (RTMs)—was carried in the belly of passenger aircraft, while the other 45 percent was carried by dedicated freighter aircraft. This marks an approximate return to the prepandemic ratio. During the early years of the pandemic, in 2020 and 2021, less than one-third of international air freight was carried by cargo aircraft, as the number of international passenger flights plummeted.
According to Department of Transportation data, within the United States, more than 90 percent of domestic air cargo is carried by dedicated freighter aircraft, which isn’t surprising considering the extent of the networks of FedEx, UPS, and Amazon Air (which contracts with several cargo airlines to carry freight under its brand).
In addition, over 70 percent of international air cargo transported by U.S. carriers is also carried by dedicated freighter aircraft. (This statistic only includes international air freight carried by U.S. airlines.) According to Cargo Newswire, FedEx, UPS, and Atlas Air were three of the top five airlines globally in terms of RTMs flown in 2023.
After weathering the pandemic, global air cargo had a good year in 2024. RTMs grew by 11.3 percent over 2023 and exceeded the levels of 2021, which was the previous record. However, according to the June 2025 IATA Global Outlook for Air Transport, global RTMs are expected to grow only .7 percent in 2025. IATA attributes this slow growth to the impact of U.S. tariffs on world trade, in addition to the removal of the de minimis exemption, which had previously allowed parcels worth less than $800 to enter the United States free of customs procedures.
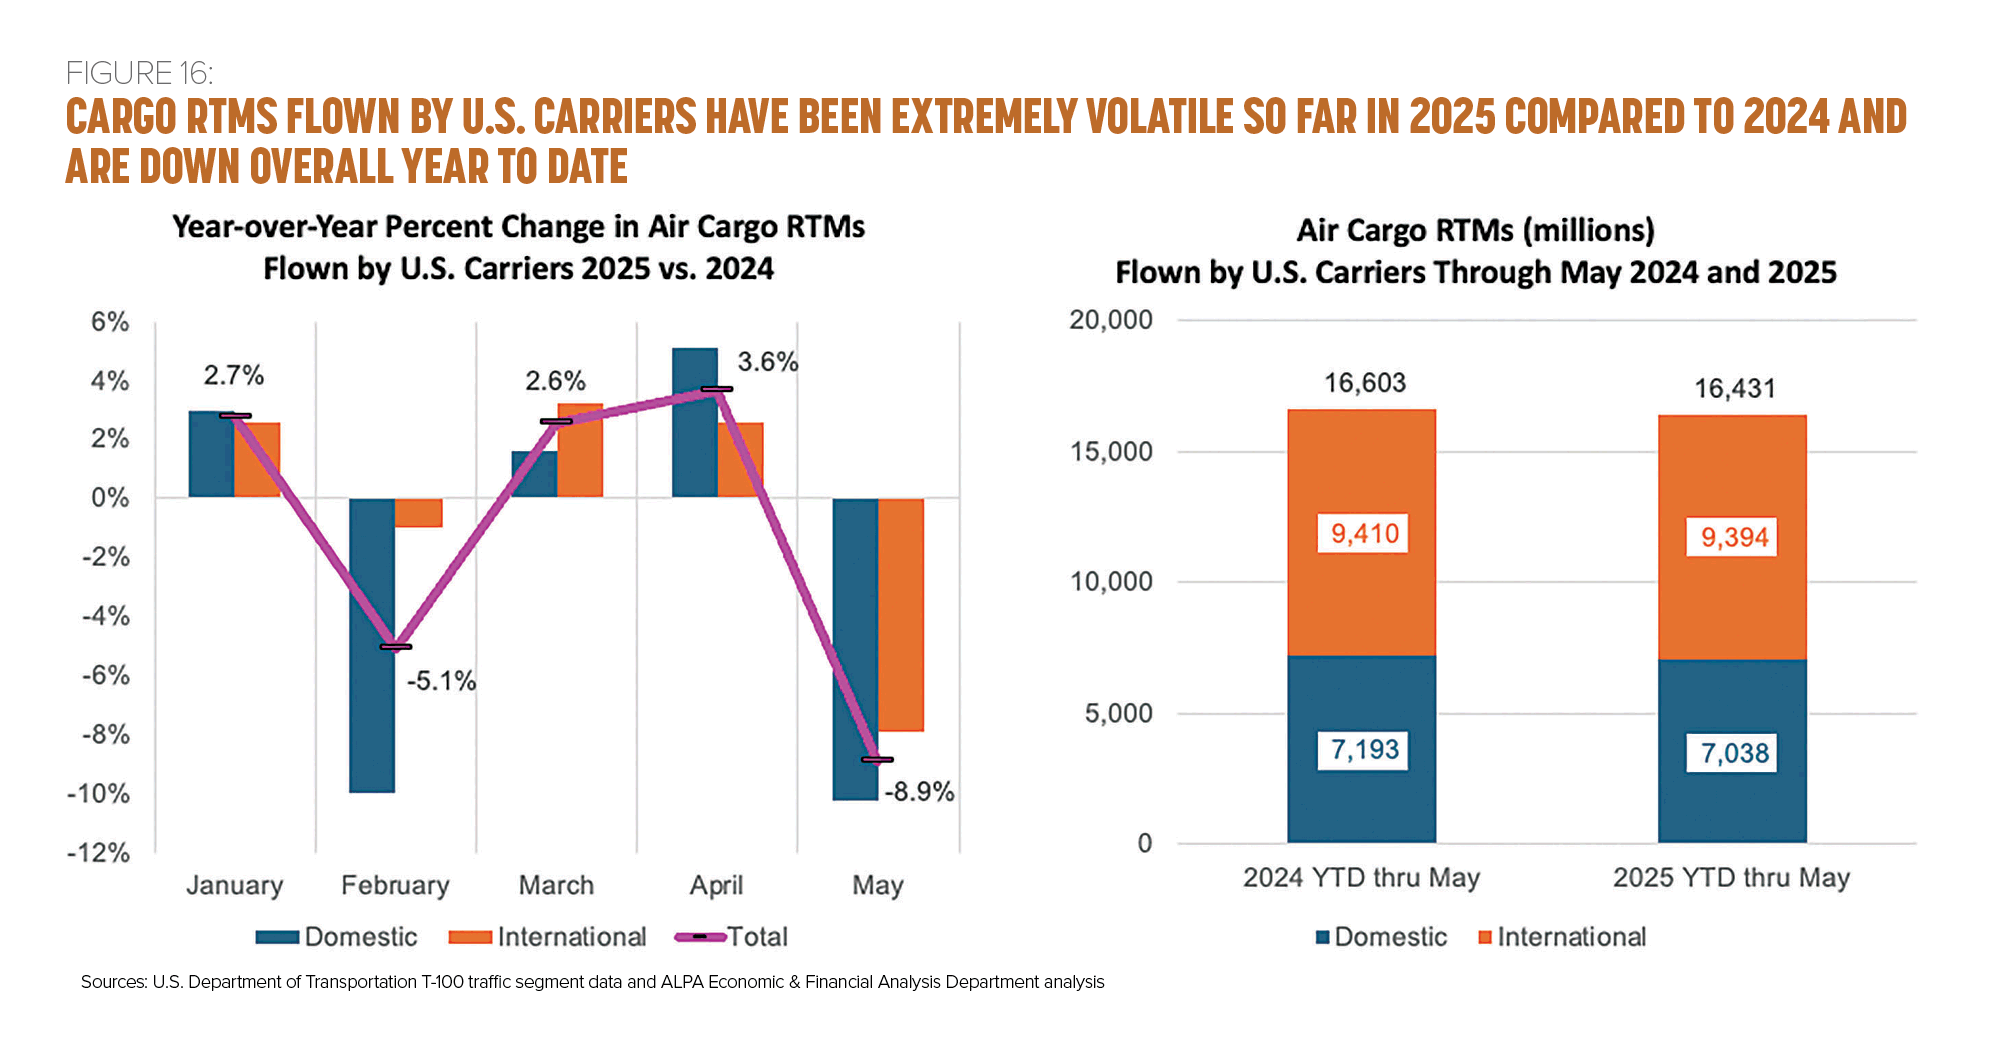
One impact of the trade uncertainty this year is the degree to which air cargo shipments have increased or decreased dramatically from month to month (compared to 2024) as tariffs have been announced, then delayed, then implemented. Shipments have typically increased ahead of expected tariffs, then decreased once tariffs took effect, and then—to some extent—increased again while tariffs were delayed. Interestingly, these dramatic ups and downs have affected domestic air cargo just as much, if not more, than international air cargo. Overall, 2025 freight RTMs flown by all U.S. airlines were down slightly year to date through May compared to the same period in 2024. This decline occurred in both domestic and international shipments (see Figure 16).
A final point worth noting is the potential impact of the elimination of the de minimis exemption. This change—while welcomed by many domestic e-commerce businesses—is expected to not only reduce the demand for Chinese and other products sold directly to U.S. consumers by overseas vendors such as Temu and Shein as the tariffs now imposed on these parcels will significantly raise their cost, but is also causing short-term administrative headaches for U.S. importers and foreign exporters. As of late August, a number of foreign postal services had temporarily suspended small parcel shipments to the United States until they could determine how to comply with the new rules.
In addition, U.S. cargo carriers such as FedEx and UPS have announced increased “peak season surcharges” for parcels, beginning this fall. Included among these surcharges are additional fees to process parcels arriving internationally.
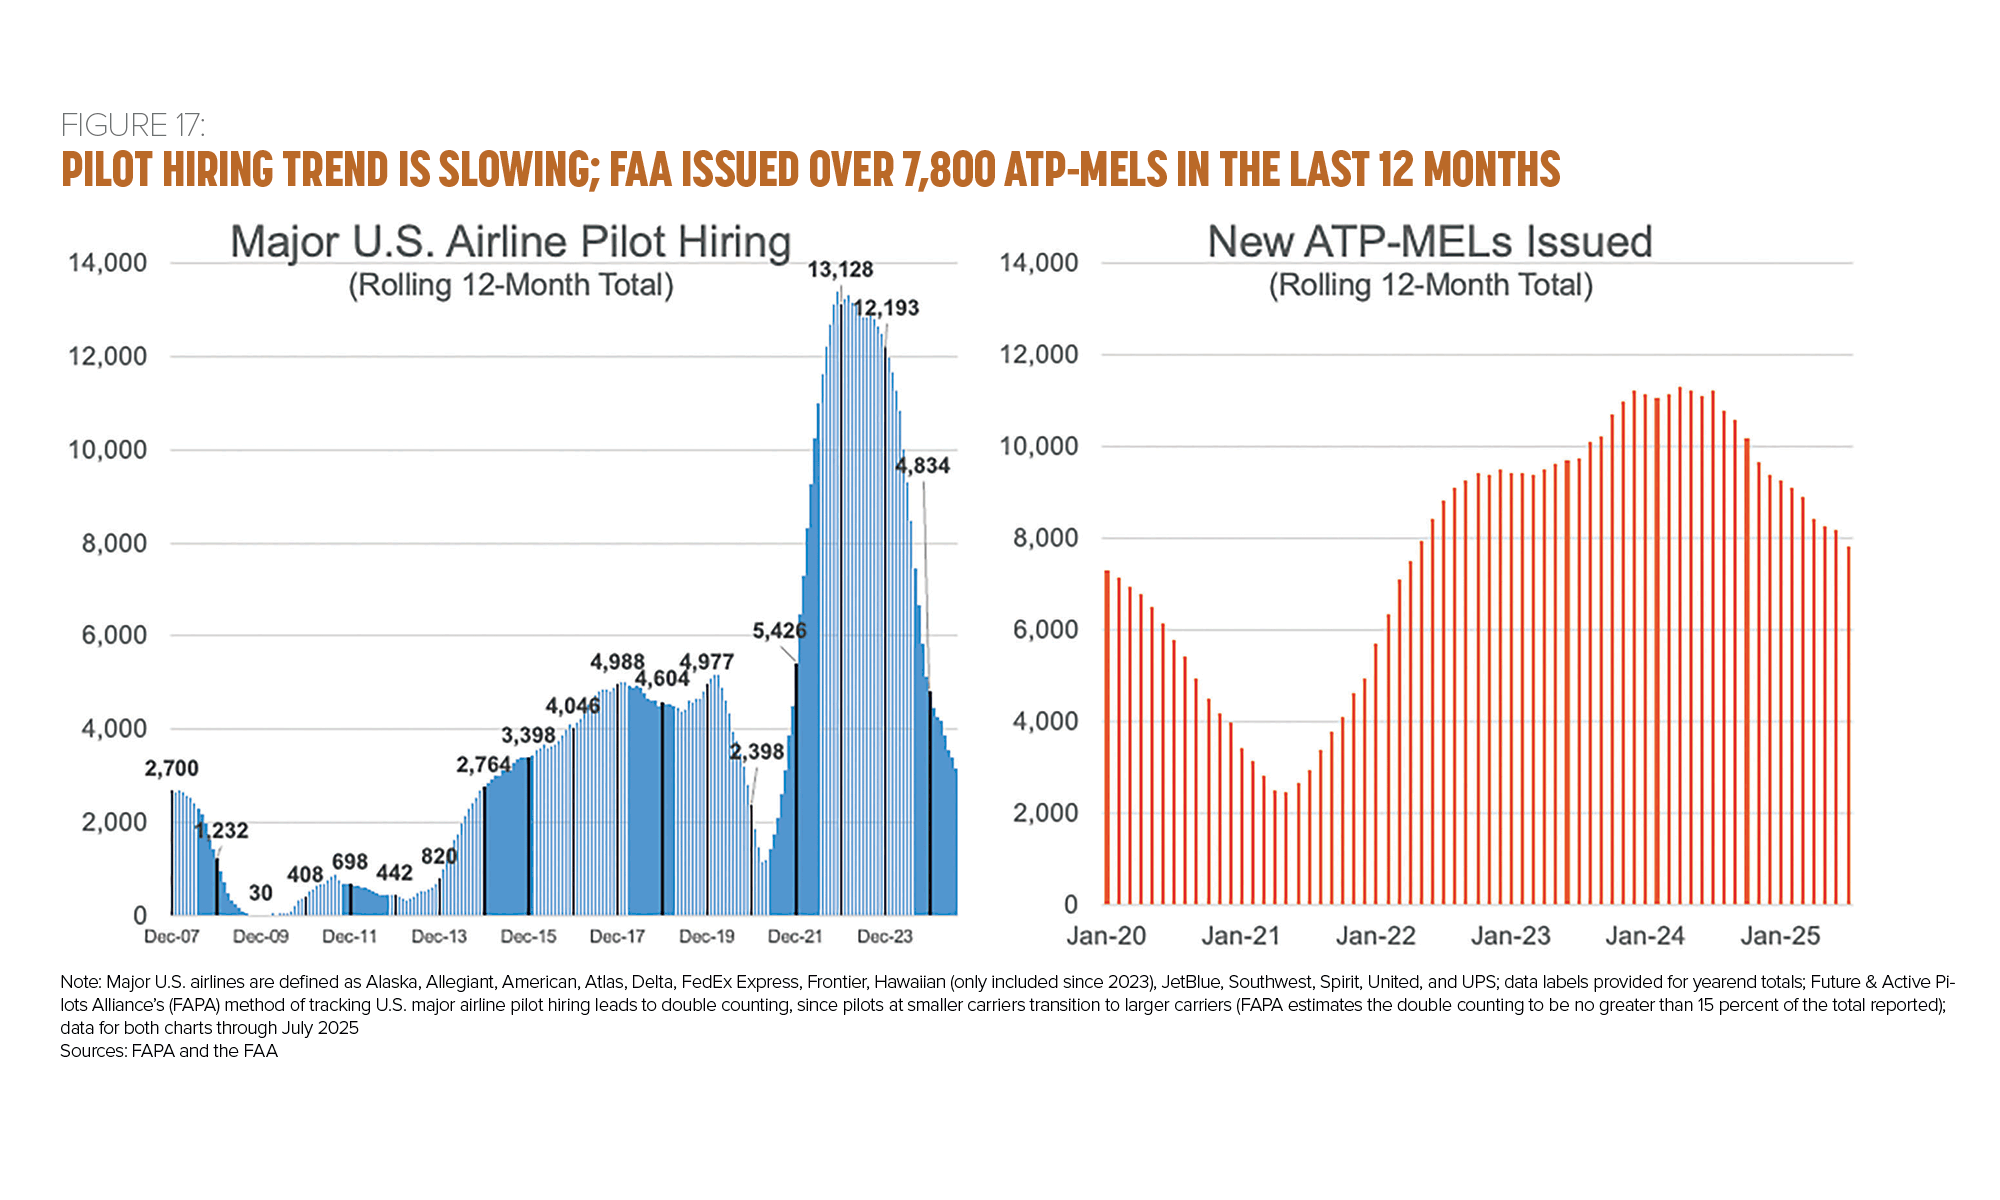
Pilot Hiring in the United States Has Slowed
After hiring a record number of pilots in 2022 and 2023, pilot hiring has slowed significantly this year. In the 12 months ending July, major U.S. airlines hired 3,181 pilots, compared to more than 13,000 pilots in 2022. Meanwhile, the FAA issued over 7,800 airline transport pilot (ATP) certificates with a multiengine land (MEL) rating over the same time frame (see Figure 17).
Through the first seven months of 2025, major U.S. airlines hired 2,242 pilots, with 1,887 (84 percent) of those hired at the “Big 3” airlines: American, Delta, and United. Spirit hasn’t hired a pilot since October 2023 while FedEx hasn’t hired a pilot since February 2023. Alaska last hired a pilot in February 2024, and JetBlue last hired a pilot in May 2024.
All indications are that pilot hiring should pick up in the second half of this year.
Overall Industry Outlook Is Optimistic
Early reports from passenger airlines for the third quarter pointed to elevated demand for September, October, and early winter. International networks, particularly across the Atlantic, are showing sustained strength. Although it’s still early, the expectations are for a stable demand and yield environment. This outlook is dependent on the level of capacity increases from airlines, the ability to maintain yields, and consumer discretionary spending on air travel not deteriorating further.
The softness seen in the economy cabin is likely to persist into the near future. This will impact low-fare carriers more than full-service carriers, as the latter can offset that softness with the resilient strength in their premium cabins.
The outlook for the cargo industry is more uncertain. While the appetite for e-commerce continues to grow and remains a positive for the industry, it’s tempered by the seemingly ever-changing U.S. trade policies.
Airlines will continue to see challenges from macroeconomic factors like inflation, volatile fuel prices, and interest and lease rates. ALPA’s Economic & Financial Analysis Department will continue to track and examine the various economic and financial indicators that impact the airline industry, as these factors play a crucial role in the careers of the Association’s members and the overall airline piloting profession.
Editor's note: Data in this article is as of September 9.

Featured Articles


